Gong, Y., Ma, Z., Li, C., Lv, X. D., Zhang, S. D., Zhou, Q. H., Huang, C. M., Huang, K. M., Yu, Y., and Li, G. Z. (2020). Characteristics of the quasi-16-day wave in the mesosphere and lower thermosphere region as revealed by meteor radar, Aura satellite, and MERRA2 reanalysis data from 2008 to 2017. Earth Planet. Phys., 4(3), 274–284. DOI: 10.26464/epp2020033
Citation:
Gong, Y., Ma, Z., Li, C., Lv, X. D., Zhang, S. D., Zhou, Q. H., Huang, C. M., Huang, K. M., Yu, Y., and Li, G. Z. (2020). Characteristics of the quasi-16-day wave in the mesosphere and lower thermosphere region as revealed by meteor radar, Aura satellite, and MERRA2 reanalysis data from 2008 to 2017. Earth Planet. Phys., 4(3), 274–284. DOI: 10.26464/epp2020033
Characteristics of the quasi-16-day wave in the mesosphere and lower thermosphere region as revealed by meteor radar, Aura satellite, and MERRA2 reanalysis data from 2008 to 2017
Quasi-16-day waves (Q16DW) were revealed by using multiple extensive data sets
Latitude and seasonal variations were revealed by using wind and temperature measurements, and a comparison was performed
The possibility of upward propagation of the Q16DW from the troposphere to the mesosphere and lower thermosphere at the three stations was examined
This study presents an analysis of the quasi-16-day wave (Q16DW) at three stations in the middle latitudes by using a meteor radar chain in conjunction with Aura Microwave Limb Sounder temperature data and MERRA2 (Modern-Era Retrospective Analysis for Research and Applications, Version 2) reanalysis data from 2008 to 2017. The radar chain consists of three meteor radar stations located at Mohe (MH, 53.5°N, 122.3°E), Beijing (BJ, 40.3°N, 116.2°E), and Wuhan (WH, 30.5°N, 114.6°E). The Q16DW wave exhibits similar seasonal variation in the neutral wind and temperature, and the Q16DW amplitude is generally strong during winter and weak around summer. The Q16DW at BJ was found to have secondary enhancement around September in the zonal wind, which is rarely reported at similar latitudes. The latitudinal variations of the Q16DW in the neutral wind and temperature are quite different. The Q16DW at BJ is the most prominent in both neutral wind components among the three stations and the Q16DW amplitudes at MH and WH are comparable, whereas the wave amplitude in temperature decreases with decreasing latitude. The quasi-geostrophic refractive index squared at the three stations in the period from 2008 to 2017 was revealed. The results indicate that the Q16DW in the mesosphere and lower thermosphere (MLT) at MH has a limited contribution from the lower atmosphere. Around March and October, the Q16DW in the troposphere at BJ can propagate upward into the MLT region, whereas at WH, the contribution to the Q16DW in the MLT region is largely from the mesosphere.
Planetary waves lasting for periods of 12 to 20 days are usually referred to as quasi-16-day waves (Q16DW), and they are believed to be a manifestation of the gravest symmetric westward-propagating Rossby normal mode at wavenumber 1 (e.g., Salby, 1981a, b; Forbes et al., 1995). Using the neutral winds obtained from meteor radar over Sheffield (53°N, 2°W), Kingsley et al. (1978) first reported the Q16DW in the MLT region over the Northern Hemisphere in the middle latitudes. Most of the reports on the Q16DW are focused on the winter hemispheric in the middle and high latitudes (e.g., Williams and Avery, 1992; Espy et al., 1997; Jacobi et al., 1998a, b; Mitchell et al., 1999; Luo Y et al., 2000, 2002a, b; Jiang GY et al., 2005; Takahashi et al., 2013; John and Kumar, 2016; Huang CM et al., 2017). In the middle and high latitudes, the Q16DW is typically strong during winter and weak during summer, based on neutral wind measurements obtained by radar (e.g., Williams and Avery, 1992; Espy et al., 1997; Namboothiri et al., 2002; Manson et al., 2004; Araújo et al., 2014; Guharay et al., 2016). At low latitudes, the Q16DW does not show significant seasonal variability (e.g., Lima et al., 2006; Araújo et al., 2014). Using neutral wind measurements obtained from two meteor radar stations at São João do Cariri (7.4°S, 36.5°W) and Cachoeira Paulista (22.7°S, 45.0°W), Araújo et al. (2014) found that the Q16DW wave was strong from spring to midsummer and weak from autumn to early winter at São João do Cariri, whereas it had no obvious seasonal variability at Cachoeira Paulista. Using temperature data obtained from the Aura Microwave Limb Sounder (MLS) from January 2005 to December 2008, McDonald et al. (2011) reported that the Q16DWs with wavenumbers 1 and 2 dominated the other modes. Comparisons of the Q16DW in the two hemispheres have been reported in many studies (e.g., Jiang GY et al., 2005; Guharay et al., 2016), and all have found that the Q16DW has similar seasonal variations in the two hemispheres.
In the past, studies of the Q16DW were largely limited to data collected from one or two types of instruments. In this research, we studied the Q16DW by using a meteor radar chain, MLS temperature data, and Modern-Era Retrospective Analysis for Research and Applications, Version 2 (MERRA2) reanalysis data in the period from 2008 to 2017. The primary goal was to study the latitudinal difference of the Q16DW in the MLT region in neutral winds and temperature over three meteor radar stations and to investigate the contribution to the Q16DW in the MLT region from the lower atmosphere. Section 2 introduces the instruments and describes the methodology. The results and discussion are presented in Section 3. The conclusions are summarized in Section 4.
2.
Methodology
2.1
Meteor Radar Data
A meteor radar chain established by the Institute of Geology and Geophysics, Chinese Academy of Sciences (IGGCAS) was used in this study. The meteor radar chain included three stations located at Mohe (MH, 53.5°N, 122.3°E), Beijing (BJ, 40.3°N, 116.2°E), and Wuhan (WH, 30.5°N, 114.6°E), respectively. The radar chain provided the meridional wind (positive northward) and zonal wind (positive eastward) measurements in the altitude range of 80 to 100 km, with resolutions of 2 km in altitude and 1 hour in time. A detailed description of the meteor radar and data deduction method can be found in Hocking et al. (2001), Li GZ et al. (2012), and Yu Y et al. (2013). In this study, the meteor radar measurements in the period from August 2011 to November 2017 at MH, December 2008 to November 2017 at BJ, and September 2010 to November 2017 at WH were used. The data can be obtained from the website of the World Data Center (WDC) for Geophysics, Beijing (http://wdc.geophys.ac.cn/index.asp). A discussion of the radar measurements during the period of interest can be found in Ma Z et al. (2018).
2.2
MLS Temperature Data
Temperature data measured from the MLS onboard the National Aeronautics and Space Administration Earth Observing System (NASA EOS) Aura satellite were applied in this study. The Aura satellite is in a Sun-synchronous orbit at an altitude of 705 km with 98° inclination, and it passes through two local times at any fixed latitude. A detailed description of the EOS Aura MLS can be found in Waters et al. (2006) and Schwartz et al. (2008).
The MLS temperatures in the Version 4.2 data product were used in this study. As suggested by the data quality document of Livesey et al. (2017), the data products were used if the estimated precision was positive, the status was even, the quality was greater than 0.9 at 261–100 hPa and 0.2 for 83–0.001 hPa, and the convergence was less than 1.03. Data quality and convergence were defined based on Aura/MLS data processing algorithms. Additional details can be found in Livesey et al. (2017). In this study, the MLS temperature data in the MLT region (from 0.01 to 0.001 hPa) and at latitude bands within ±2° centered at MH (53.5°N), BJ (40.3°N), and WH (30.5°N) were examined. The pressure levels were converted to approximate altitudes for comparison with the meteor radar measurements by using the equation below (Andrews et al., 1987):
z=−Hln(p/ps),
where z is the log-pressure height, ps is the standard reference pressure, p is the pressure level, and H is the mean scale height, which is assumed to be 7 km in the middle atmosphere (Andrews et al., 1987). The log-pressure height is approximately equal to the geometric height in the MLT region (Andrews et al., 1987). The converted altitudes used here were ~81, ~86, ~91, and ~97 km, which are consistent with those of Day et al. (2012) and Gong Y et al. (2018). The MLS temperature data were divided into 12 bins with a 30° interval in longitude (e.g., Day et al., 2012; Gong Y et al., 2018).
2.3
MERRA2 Reanalysis Data
The MERRA2 data used in this study were provided by the Goddard Earth Observing System, Version 5. The MERRA2 data are a reanalysis of the global atmosphere covering the data-rich period since 1980. The reanalysis data applied in this study had a horizontal resolution of 0.5° × 0.625° with a temporal resolution of 1 day, and the data had 36 pressure levels that covered an altitudinal range of ~20 to ~80 km. A detailed description of the MERRA2 reanalysis data can be found in Molod et al. (2015).
2.4
Data Processing
Data on hourly neutral winds measured by the meteor radar chain and daily mean temperature data obtained from the MLS were used to analyze the Q16DW in the MLT region. To extract the amplitudes of the Q16DW wave from both the ground-based and space-based measurements, a 48-day sliding window with a step of 1 day was used in this study (e.g., Wu DL et al., 1995; Luo Y et al., 2002a, b; Namboothiri et al., 2002; Jiang GY et al., 2005; McDonald et al., 2011). Because the period of the Q16DW is in a range from 12 to 20 days, in each sliding window, the Lomb–Scargle analysis in the meteor radar measurements was applied to obtain the periodogram of the neutral winds. On the basis of the Lomb–Scargle results, the dominant oscillation mode within the period of 12 to 20 days was regarded as the period of the Q16DW. The amplitude of the Q16DW was then extracted by using least squares fitting.
For the space-based measurements, because Q16DWs with different zonal wavenumbers could be differentiated, zonal wavenumbers of 3 to −3 were simultaneously fitted. The positive (negative) wavenumbers corresponded to westward (eastward)-propagating waves, and 0 corresponded to the stationary planetary wave. Note that we used a 48-day sliding window with a step of 1 day in this study. In each fitting window, the wave periods from 12 to 20 days were examined in daily steps. The largest amplitudes within the period range were regarded as Q16DWs (e.g., Day et al., 2011). The fitting function is given by the following equation (Wu DL et al., 1995):
y=∑3s=−3[Ascos(2πσt+sλ)+Bssin(2πσt+sλ)],
(2)
where t is the time in days, s is the zonal wavenumber from −3 to 3, σ is the investigated wave frequency, and λ is the longitude in degrees. Variables As and Bs are the parameters to be fitted to derive the wave amplitudes. The wave amplitudes can be calculated as A=2√(As)2+(Bs)2, and the initial phase can be calculated as φ0=tan−1(Bs/As). A more detailed description can be found in Wu DL et al. (1995). Note that, in each fitting window, if the data gap was longer than one-third of the period of interest or if more than 25% of the total data were missing, no analysis was performed (Kishore et al., 2004; Huang CM et al., 2017).
3.
Results and Discussion
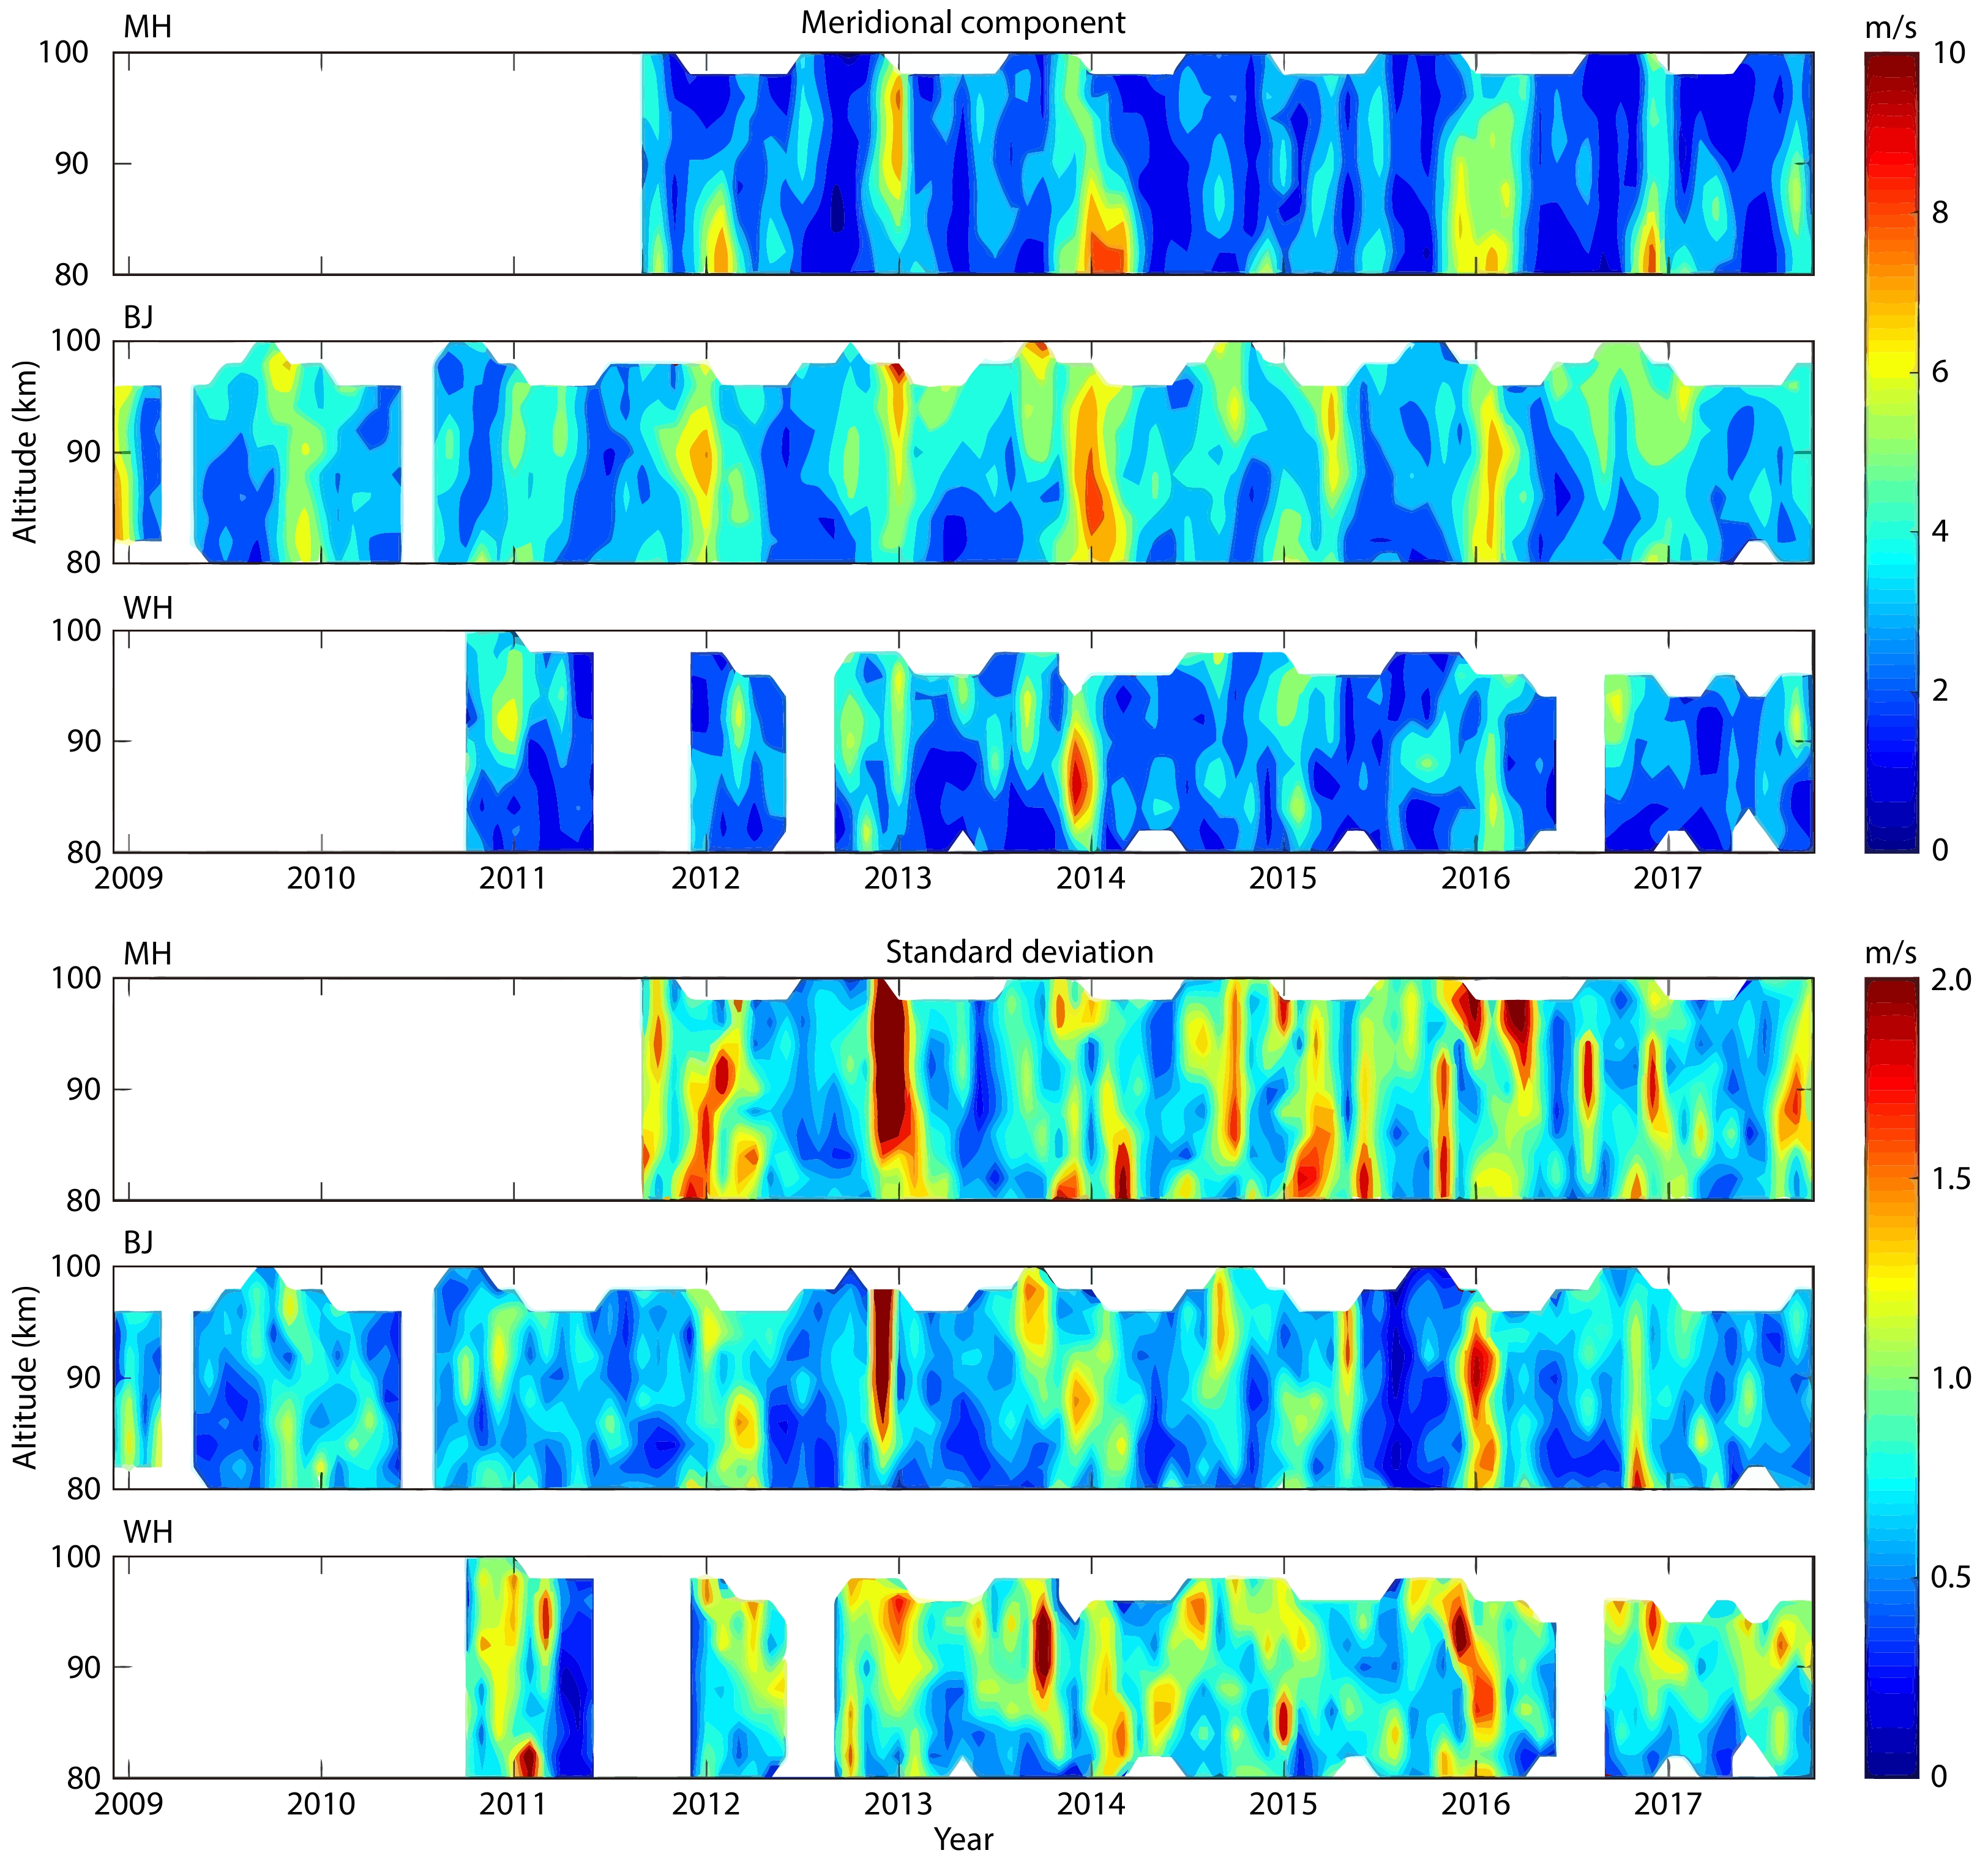
Figure 1 (top) shows the monthly mean amplitudes of the Q16DW obtained from the meteor radar chain in the meridional component. The white area indicates that the data either were not available or did not satisfy the fitting criterion. The bottom panel in Figure 1 provides the standard deviations of the monthly mean amplitudes in the meridional wind. According to Figure 1 (top), the Q16DW amplitudes show significant interannual and seasonal variability across the three stations. The peak amplitudes occur mainly in winter, which is consistent with previous studies (e.g., Luo Y et al., 2002a, b; Jiang GY et al., 2005). The Q16DW activity was also found to be significant during early spring, although this feature was not common to all years. As shown in Figure 1 (bottom), the standard deviations of the monthly mean amplitudes are generally smaller than 2 m/s. The largest standard deviations occur at MH and BJ in the winter of 2013, reaching 2.8 m/s.
Figure
1.
Temporal and altitudinal variations of the monthly-mean amplitudes (top) and standard deviation (bottom) of the quasi-16-day waves in the meridional component over Mohe (MH, 53.5°N, 122.3°E), Beijing (BJ, 40.3°E, 116.2°E), and Wuhan (WH, 30.5°N, 114.6°E) from December 2008 to November 2017.
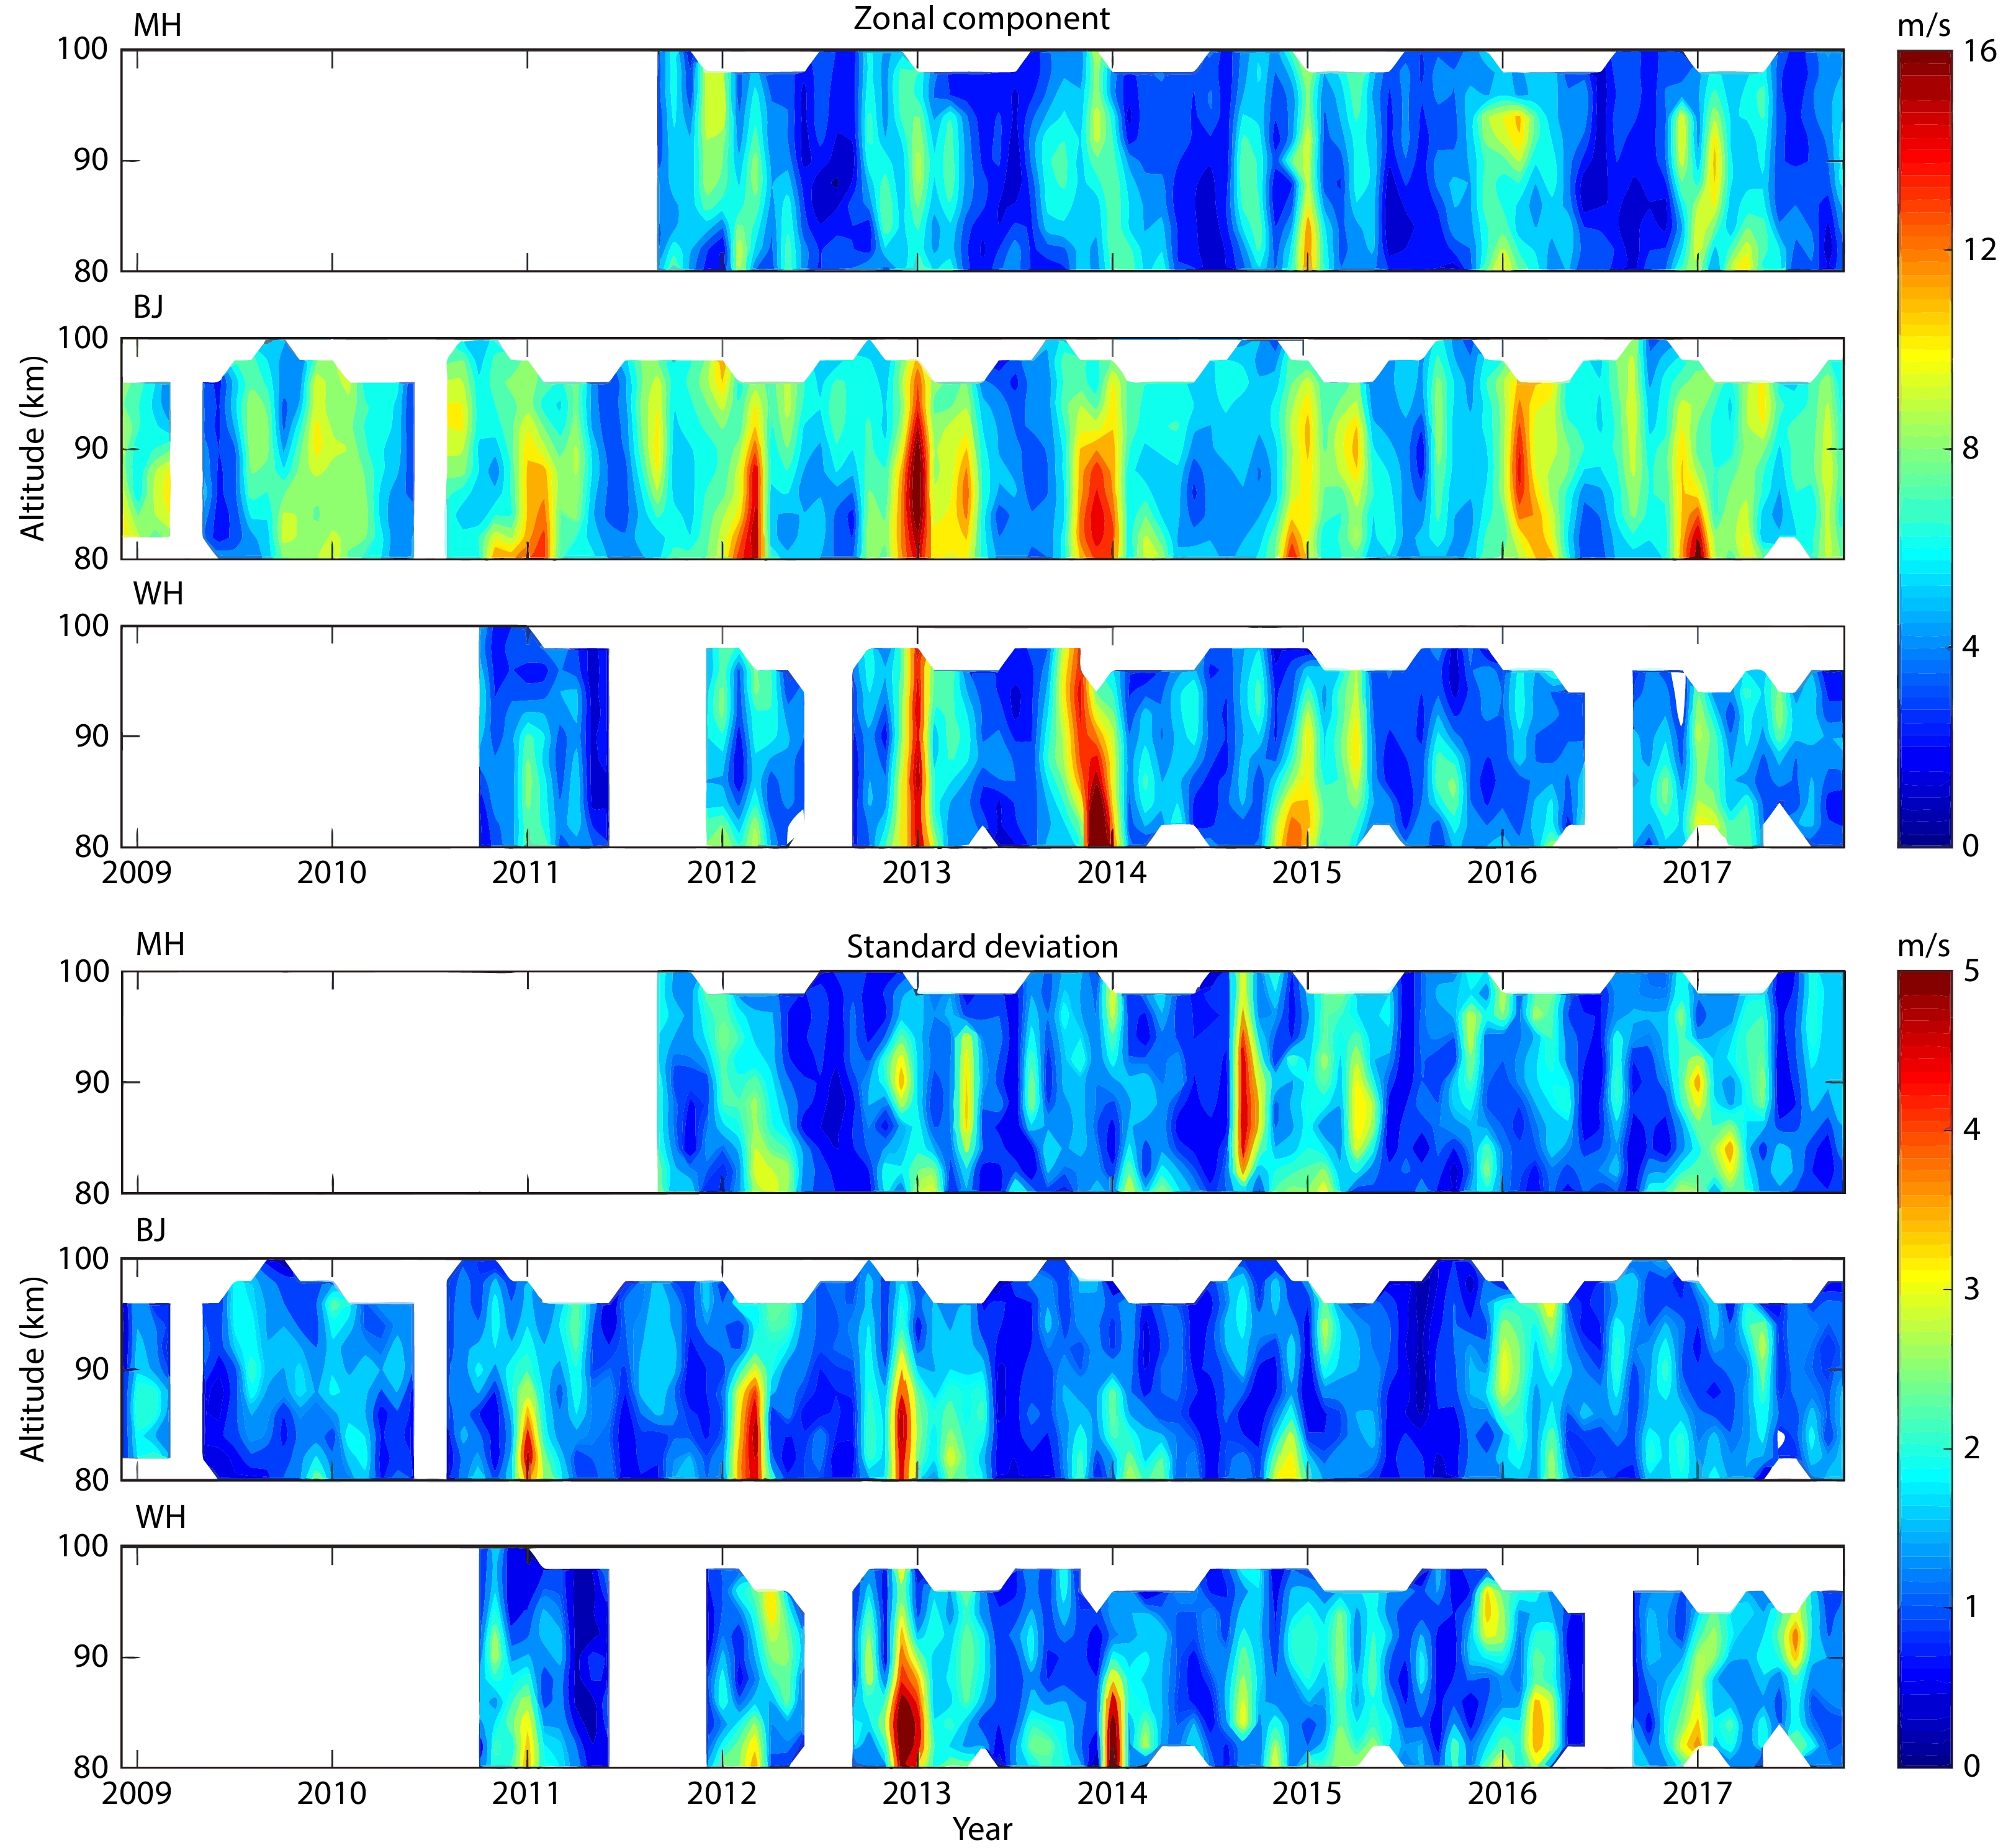
Figure 2 presents the temporal variation of the Q16DW amplitudes (top) and their standard deviations (bottom) in the zonal wind. As shown in Figure 2 (top), the amplitudes of the Q16DW in the zonal component are stronger than those in the meridional component. As in the meridional component, the Q16DW in the zonal component is enhanced during winter. The Q16DW amplitude at BJ during winter appears to be the most prominent among the three stations. The Q16DWs reach their maximum amplitudes of ~18 m/s at BJ in January 2013 and of 24 m/s at WH in December 2013. As shown in Figure 2 (bottom), the standard deviations are generally less than 4 m/s. The largest standard deviation, of 6 m/s, occurs in December 2013 at WH.
Figure
2.
Same as Figure 1 but for the zonal component.
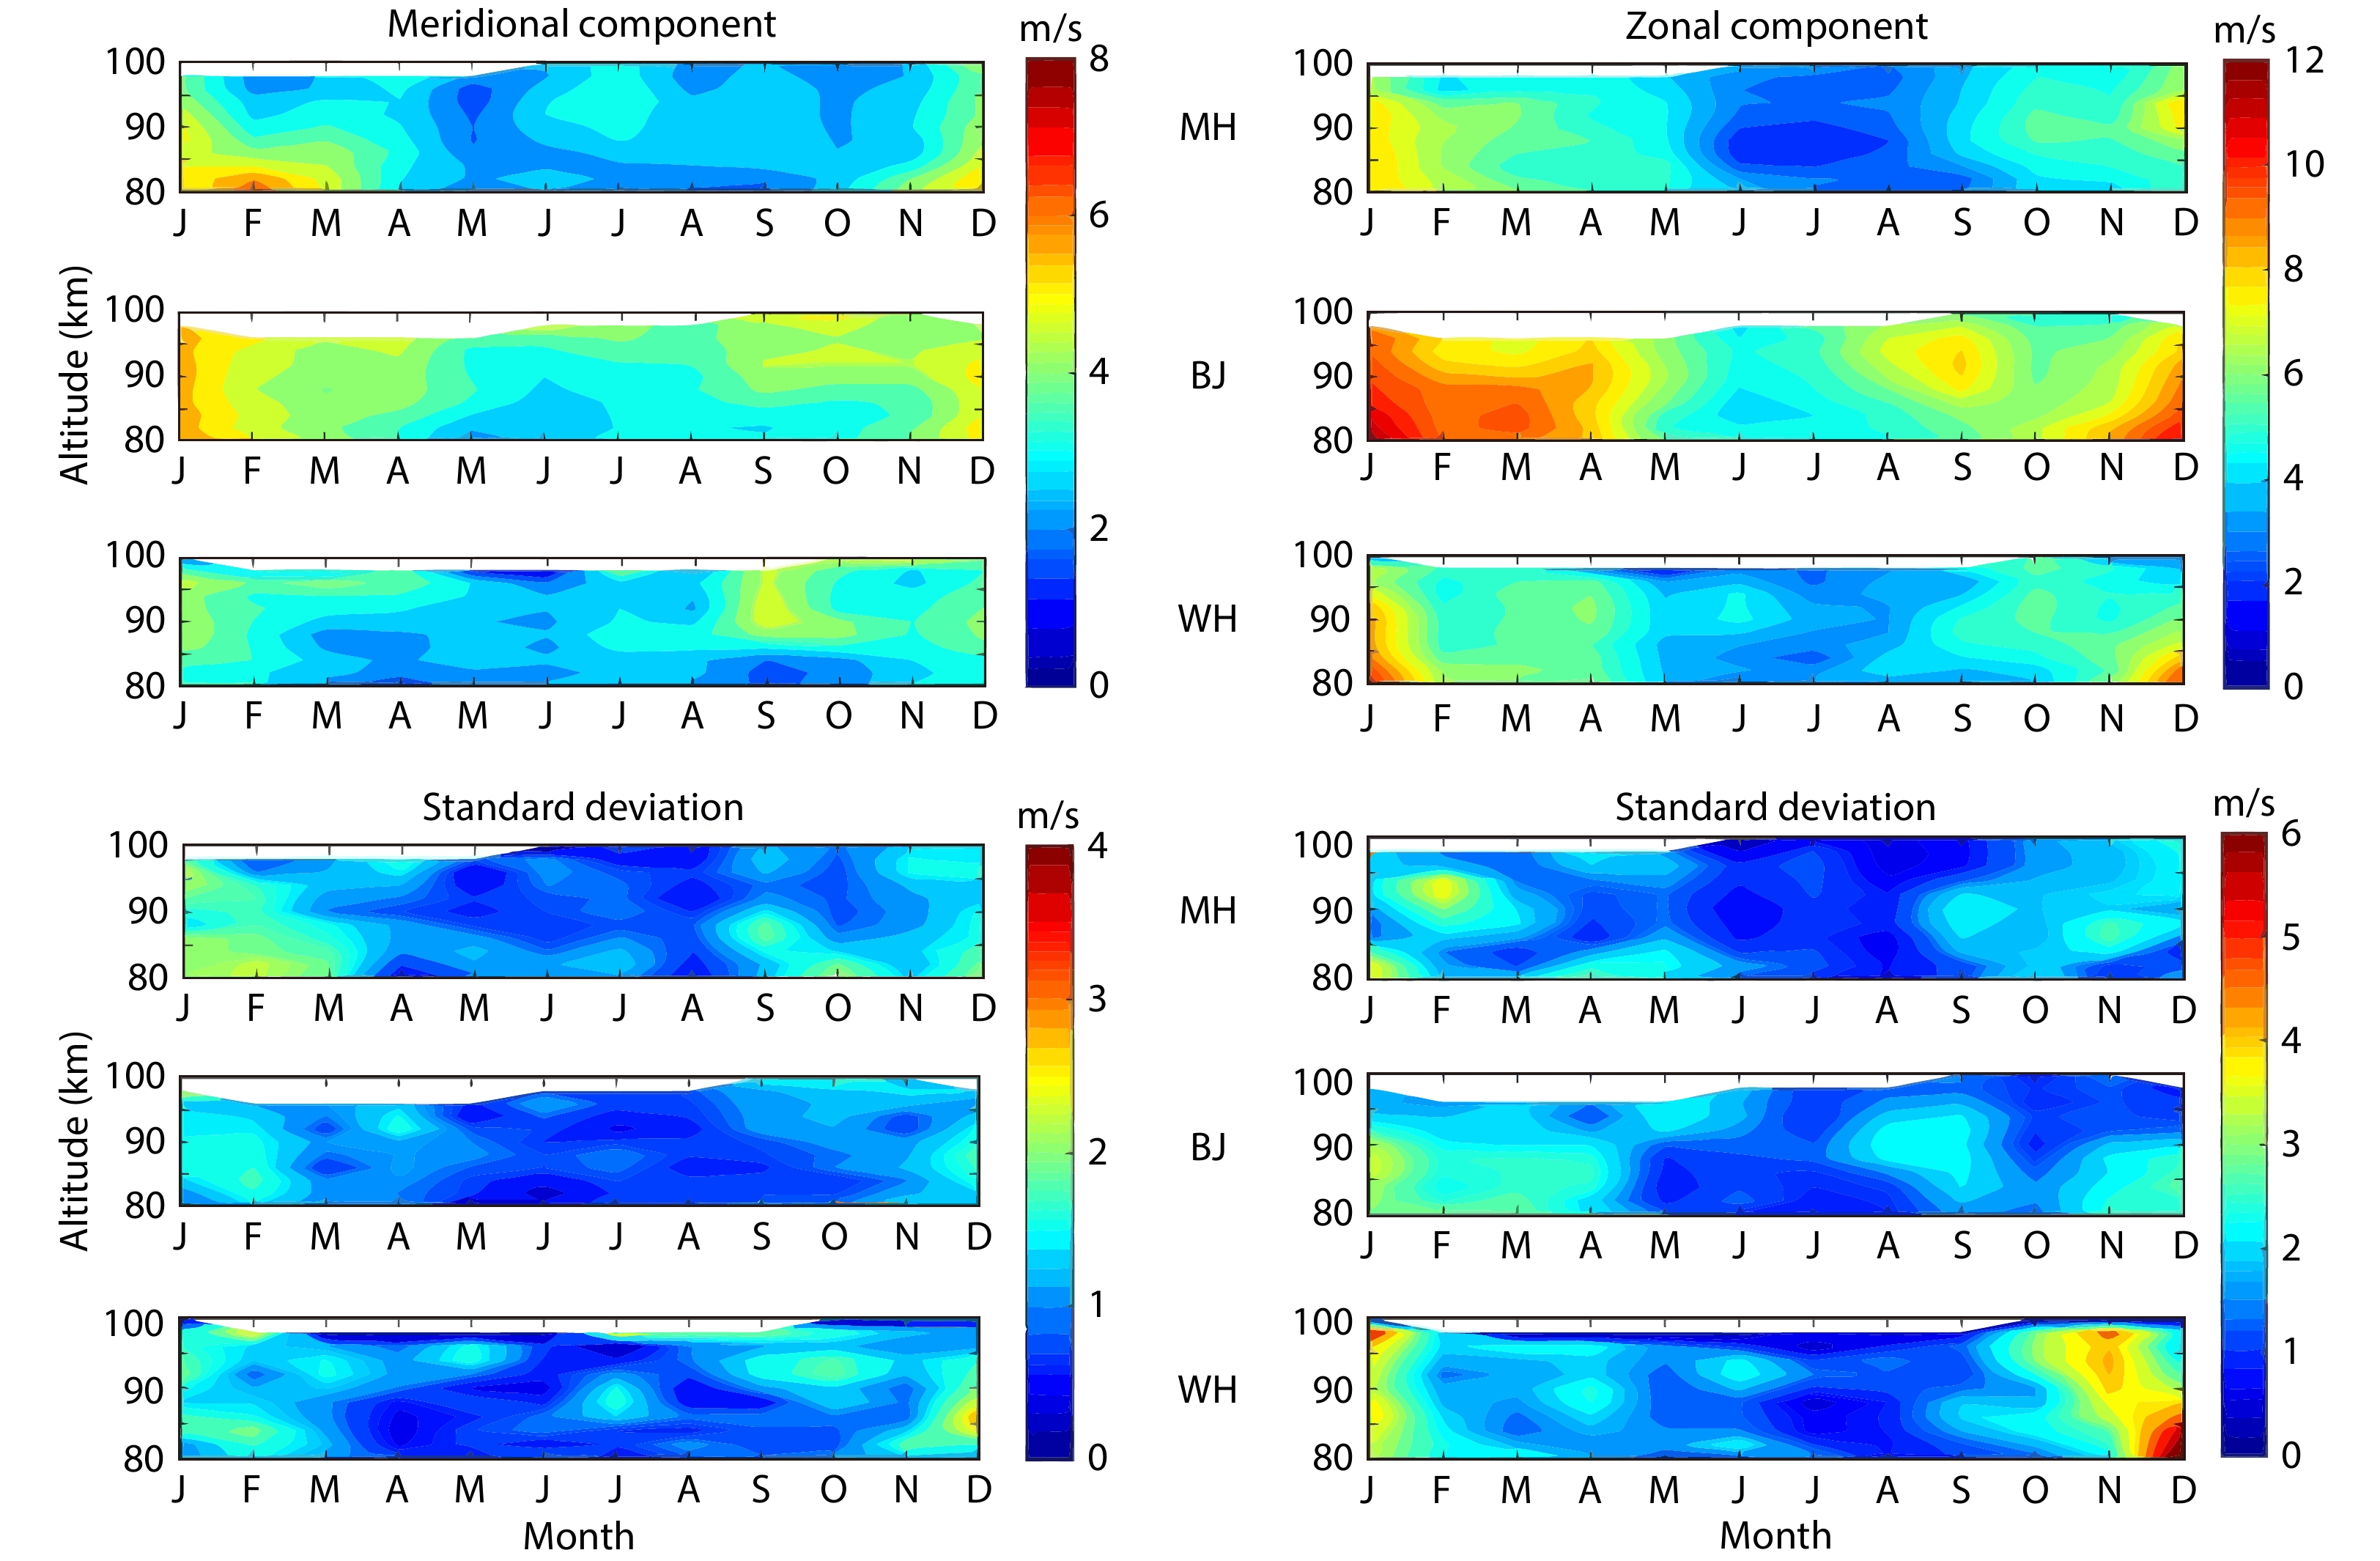
Composite-year results were computed by averaging the monthly mean amplitudes from all years, as shown in Figure 3. The standard deviations are presented in the bottom panels of Figure 3. As illustrated in Figure 3, the Q16DW amplitudes in the zonal component (top right) are generally larger than those in the meridional wind (top left) at all three stations. At MH, the maximum amplitude appears during winter in both components. The Q16DW amplitudes are the weakest during May and October in the meridional wind and during June and July in the zonal component. At BJ, the strong Q16DW amplitudes appear in winter, early spring, and September in the zonal wind. In the meridional wind, the Q16DW amplitudes at BJ are generally larger than those at MH. The seasonal variations of the Q16DW amplitudes at WH are similar to those at MH in the zonal wind. In the meridional wind, the amplitudes appear to be the strongest around September above 90 km. According to the bottom panels of Figure 3, the standard deviations at BJ are the smallest, and the maximum uncertainty occurs at WH during winter in the zonal wind.
Figure
3.
Monthly-mean amplitudes (top) and standard deviation (bottom) of the quasi-16-day waves in a composite-year in the meridional component (left column) and the zonal component (right column) at Mohe (MH, 53.5°N, 122.3°E), Beijing (BJ, 40.3°E, 116.2°E), and Wuhan (WH, 30.5°N, 114.6°E), respectively.
Using 3 years of data from 1993 to 1995 measured by multiple medium-frequency radar stations located at Tromso (70°N, 19°E), Saskatoon (52°N, 107°W), London (43°N, 81°W), Hawaii (21°N, 157°W), and Christmas Island (2°N, 157°W), together with numerical results, Luo et al. (2002b) reported that the Q16DW amplitude in the zonal wind is greater than in the meridional wind. Our results using an extensive data set verify this statement. According to Fig.5 of Luo Y et al. (2002b), the latitudinal variation of the Q16DW amplitude at those five stations is limited. However, according to our observation, the Q16DW amplitude at BJ is the strongest among the three stations in both wind components. A strong secondary peak was observed at BJ around September in the zonal wind, which is rarely reported at similar latitudes. In addition, the Q16DW amplitude at BJ had the least uncertainty; its standard deviation was generally the smallest among the three stations. Using medium-frequency radar located in the latitudinal range from 31°N to 52°N, Manson et al. (2004) indicated that the annual increment in the Q16DW is from September to wintertime, especially for zonal wavenumbers 1 and 4. They reported that slight enhancements of the Q16DW were observed only at the end of September in 2000 over Wakkanai (45°N, 141°E) and Yamagawa (31°N, 130°E), although these amplitudes were not comparable with the enhancements in December and January. Takahashi et al. (2013) observed the Q16DW from the autumn equinox to the spring equinox in mesospheric winds over Wakkanai. They proposed that the Q16DW in the MLT region may be triggered by a phase change of the zonal winds. Ma Z et al. (2018) presented seasonal variations of the mean winds over BJ. They found that zonal winds above 90 km weakened as they moved westward during the autumn equinox at BJ. Thus, the secondary enhancement around the autumn equinox at BJ may be associated with a phase change of the zonal winds in September.
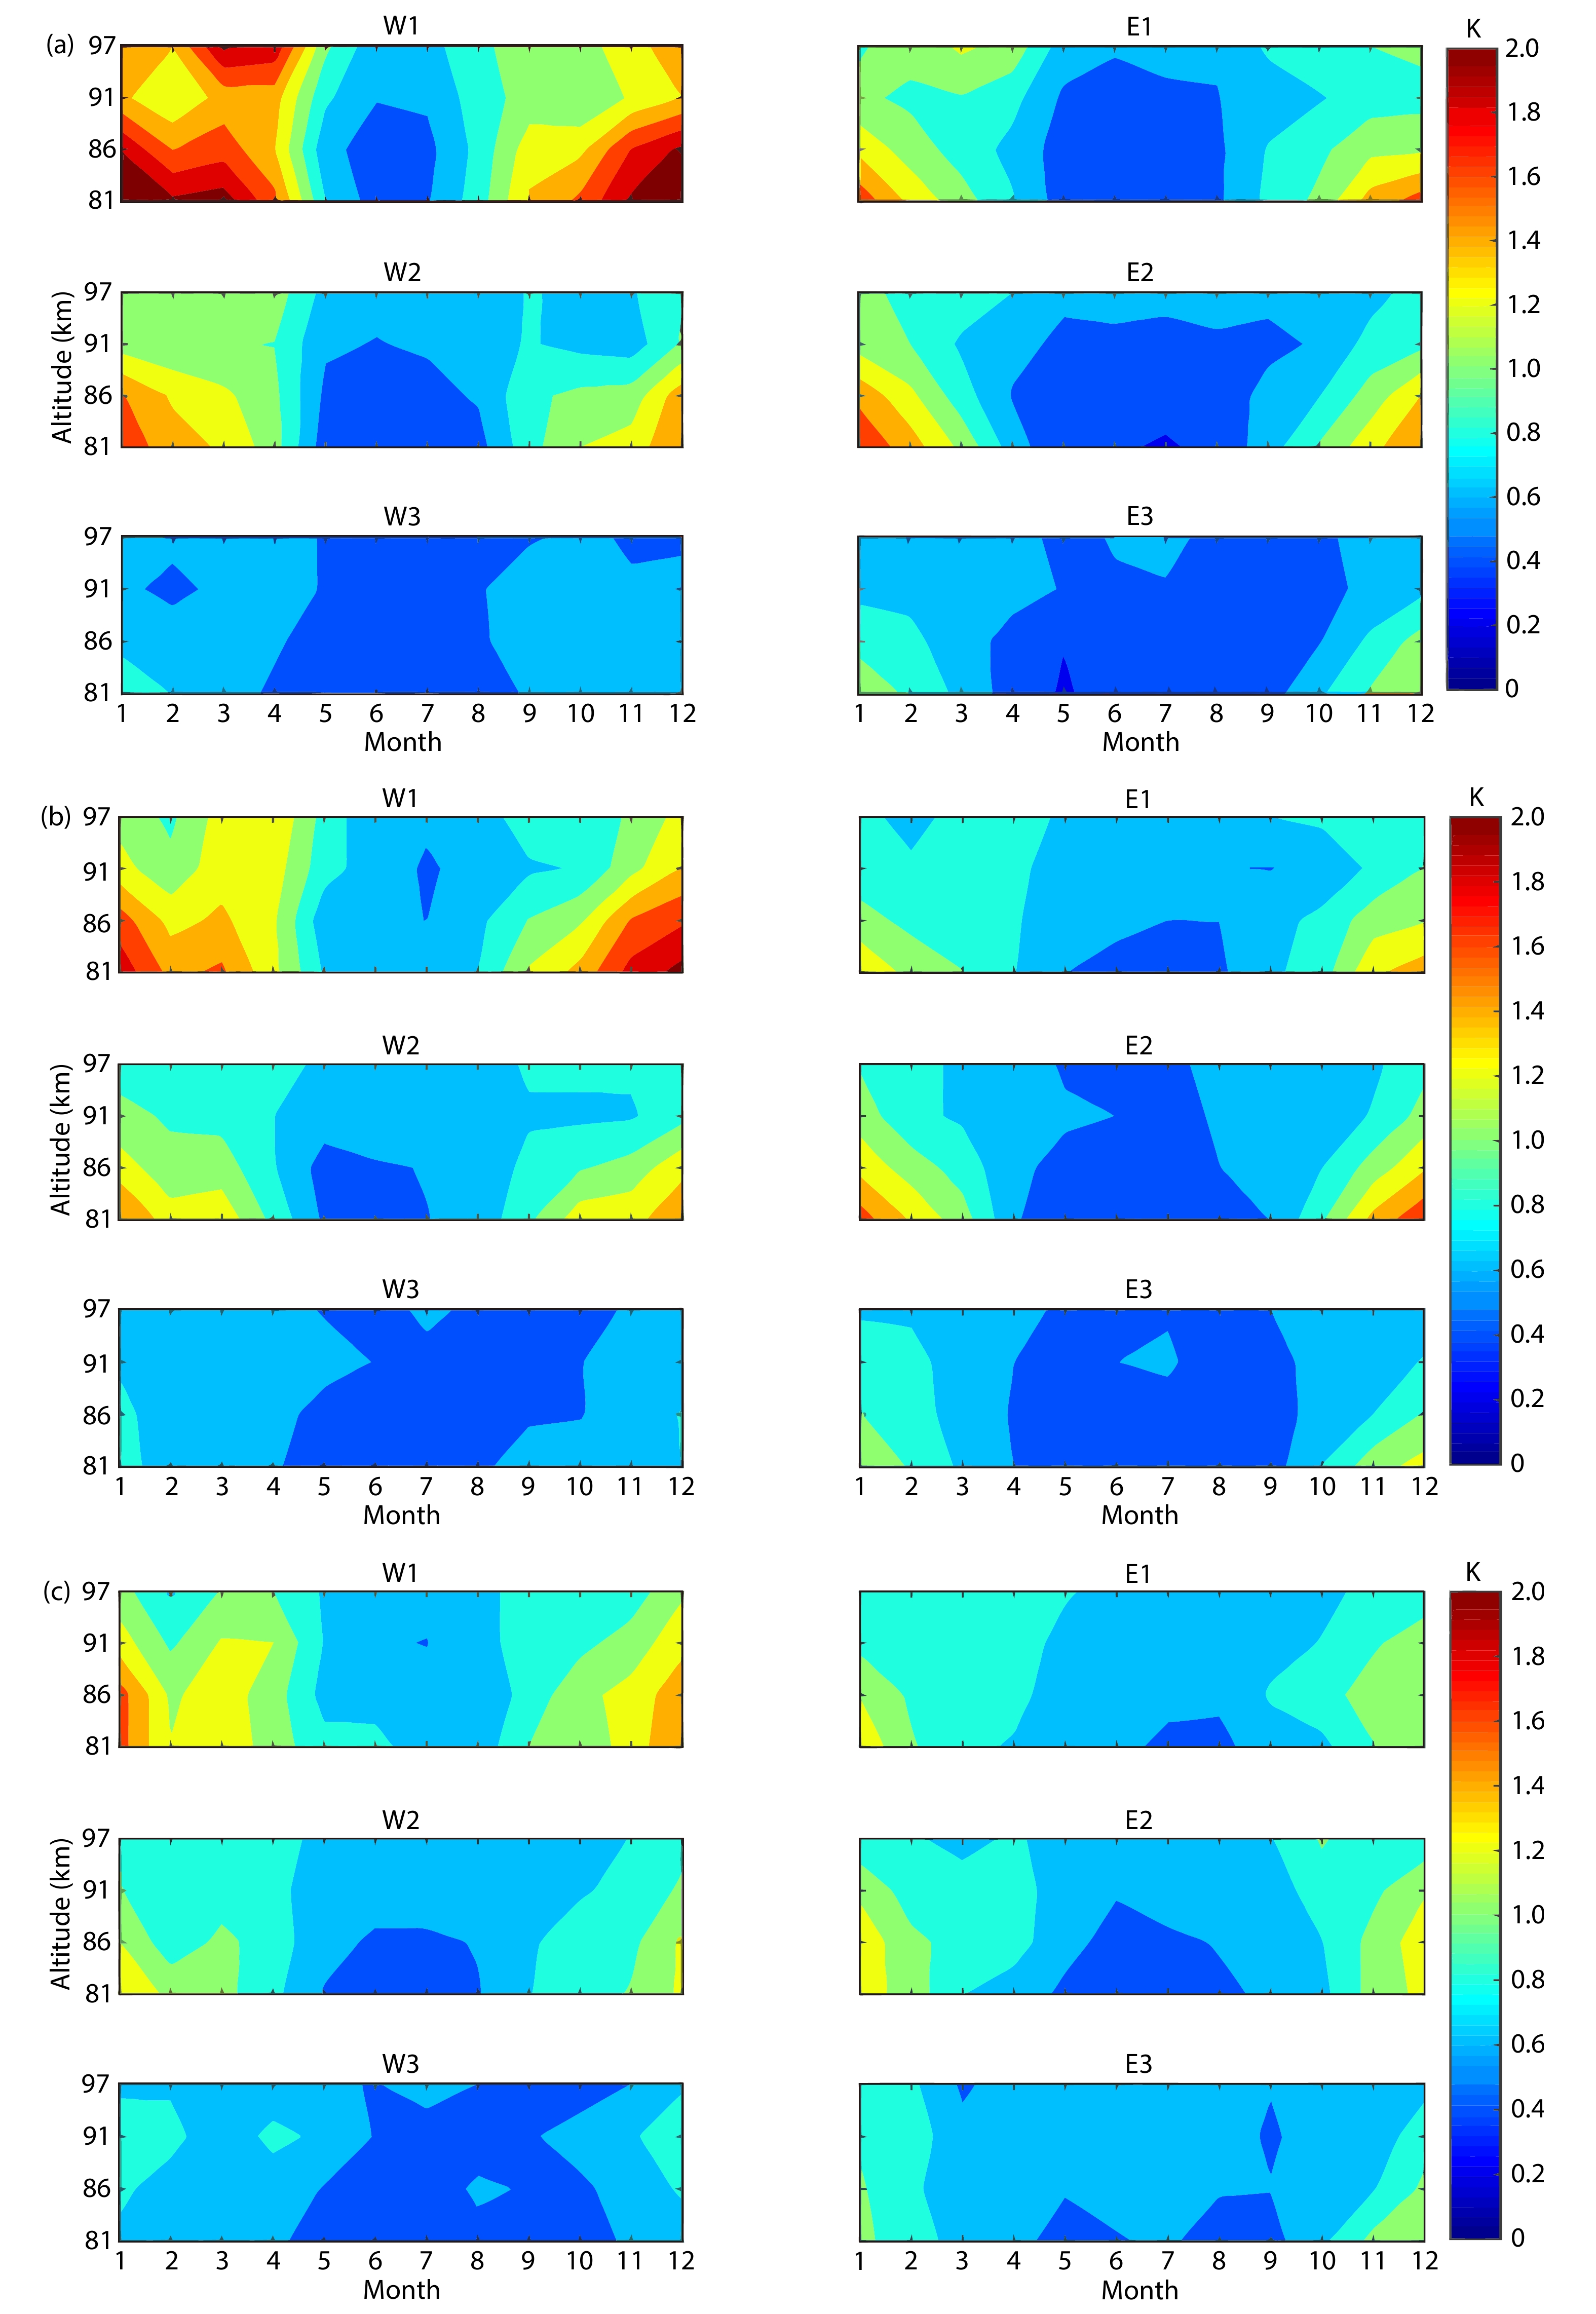
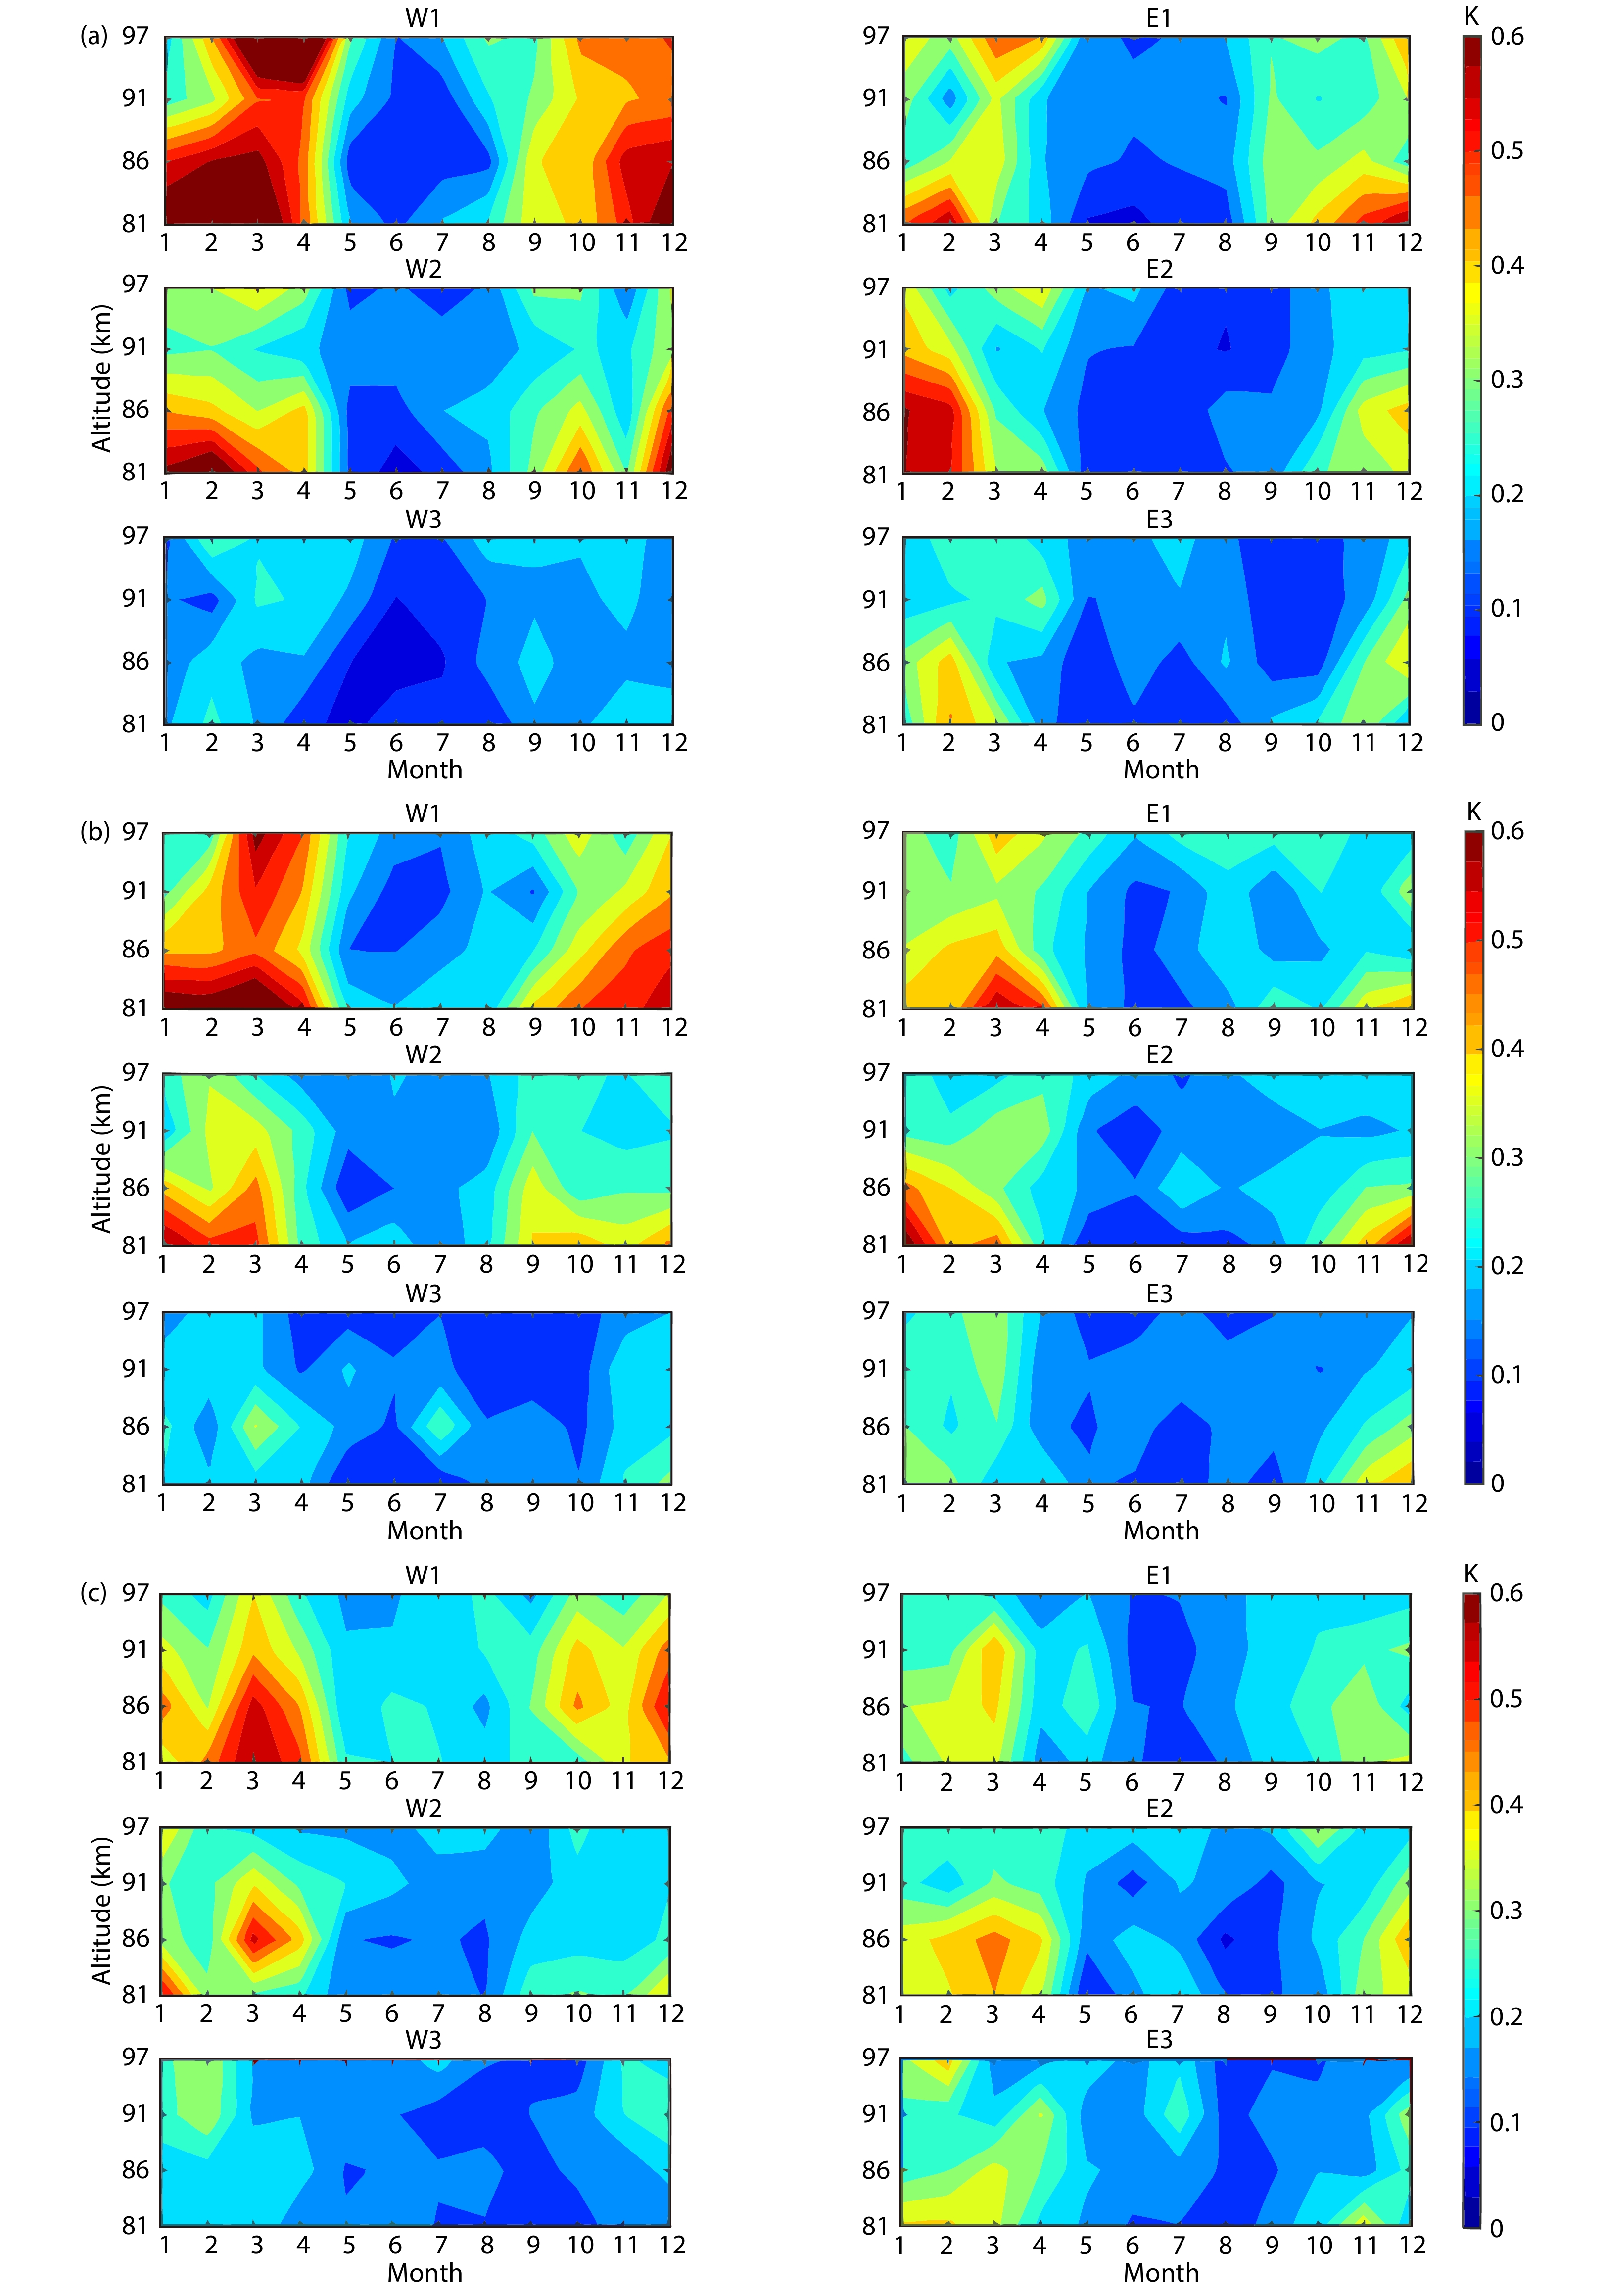
To compare Q16DWs in neutral winds and temperature, the westward- and eastward-propagating Q16DWs with wavenumbers from 1 to 3 (W1, W2, W3, E1, E2, E3) were obtained by using MLS temperature data. Note that temperature data in the latitude bands of ±2° latitude centered at MH (53.5°N), BJ (40.3°N), and WH (30.5°N) were used in this study. Figure 4 displays the monthly mean amplitudes of the six wave modes in a composite-year at (a) MH, (b) BJ, and (c) WH. The noise levels at different altitudes and stations were computed by using the conservative methodology described by McDonald et al. (2011) and were less than 0.35 K. As shown in Figure 4, the amplitudes of the W1, W2, E1, and E2 components are strong during winter and weak around summer, which is consistent with the results in the neutral winds. Westward-propagating wavenumber 1 is the strongest component among all the wave modes. Westward-propagating wavenumber 3 and E3 appear to be the least important components because their amplitudes are generally less than 0.6 K at the three stations. The standard deviations of the W1, W2, W3, E1, E2, and E3 components in a composite-year at MH (a), BJ (b), and WH (c) are shown in Figure 5. According to Figure 5, the standard deviation is larger where the amplitude is stronger. The standard deviation is generally smaller than 0.6 K. Larger standard deviations occur during winter and early spring.
Figure
4.
Monthly-mean amplitudes of the different normal modes of the quasi-16-day wave in a composite-year obtained from the MLS temperature at (a) Mohe (MH, 53.5°N, 122.3°E), (b) Beijing (BJ, 40.3°E, 116.2°E), and (c) Wuhan (WH, 30.5°N, 114.6°E), respectively.
A comparison of Figures 3 and 4 shows that the Q16DWs in neutral winds and temperatures illustrate that the Q16DWs are strong during winter. However, the strong Q16DW signals that appeared in September at BJ in the zonal wind and at WH in the meridional wind were not found in the temperature data. The major difference in the Q16DW obtained from the ground-based and satellite measurements was the latitudinal variation. As discussed before, the Q16DW at BJ is the most prominent in the neutral wind. However, Figure 4 indicates that the amplitudes of the W1, W2, E1, and E2 modes decrease as the latitude decreases. Using 5 years (2003–2007) of TIMED/SABER temperature measurements, John and Kumar (2016) reported that W1 and E1 are the most prominent modes and that they decrease as the latitude decreases. Using 4 years (2005–2008) of MLS temperature data, McDonald et al. (2011) found that the westward-propagating Q16DWs are prominent around 55° N and decrease as the latitude decreases. Our satellite-based results are consistent with these previous studies. According to our analysis, at the three stations, the Q16DW amplitude in temperature decreases as the latitude decreases, whereas the amplitude in the neutral wind is the most prominent at BJ and is comparable at MH and WH. Note that because the Q16DWs in neutral winds are derived from a single location, the Q16DWs over MH, BJ, and WH exhibit the combined effects of the Q16DW with different modes. The Q16DWs obtained from the Aura satellite could be differentiated into different wave modes. This may be the reason the latitudinal variations of Q16DWs are different in neutral winds and temperature. However, numerical investigations are needed to further understand why the Q16DW amplitude in temperature in the MLT region decreases as the latitude decreases, whereas this decreasing trend is not observed in the neutral winds over the three radar stations.
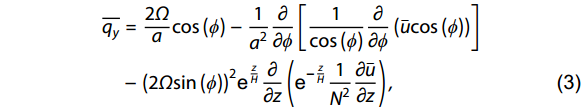
The Q16DW in the MLT region is generally thought to be excited in the lower atmosphere and to propagate upward (e.g., Malinga and Poole, 2002a, b; Day et al., 2011; Guharay et al., 2016). The quasi-geostrophic refractive index squared (¯Qk,c) has been widely used to indicate the vertical propagation of planetary waves (Randel, 1988; McDonald et al., 2011). The propagation of planetary waves is prevented in regions where the refractive index squared is negative, whereas it is permitted in regions where the refractive index squared is positive (Charney and Drazin, 1961; Smith, 2003). The quasi-geostrophic refractive index squared can be computed from the gradient in the quasi-geostrophic vorticity (¯qy), which can be obtained via (McDonald et al., 2011)
where Ω is the angular velocity of the Earth, a is the radius of the Earth, ϕ is the latitude, z is the vertical coordinate,¯u is the zonal mean wind, H is the scale height, and N is the Brunt–Väisälä frequency. Then ¯Qk,c can be calculated via (McDonald et al., 2011)
¯Qk,c=[¯qyˉu−c−k2a2cos2ϕ−(2Ωsin(ϕ))24H2N2]sin2ϕ,
(4)
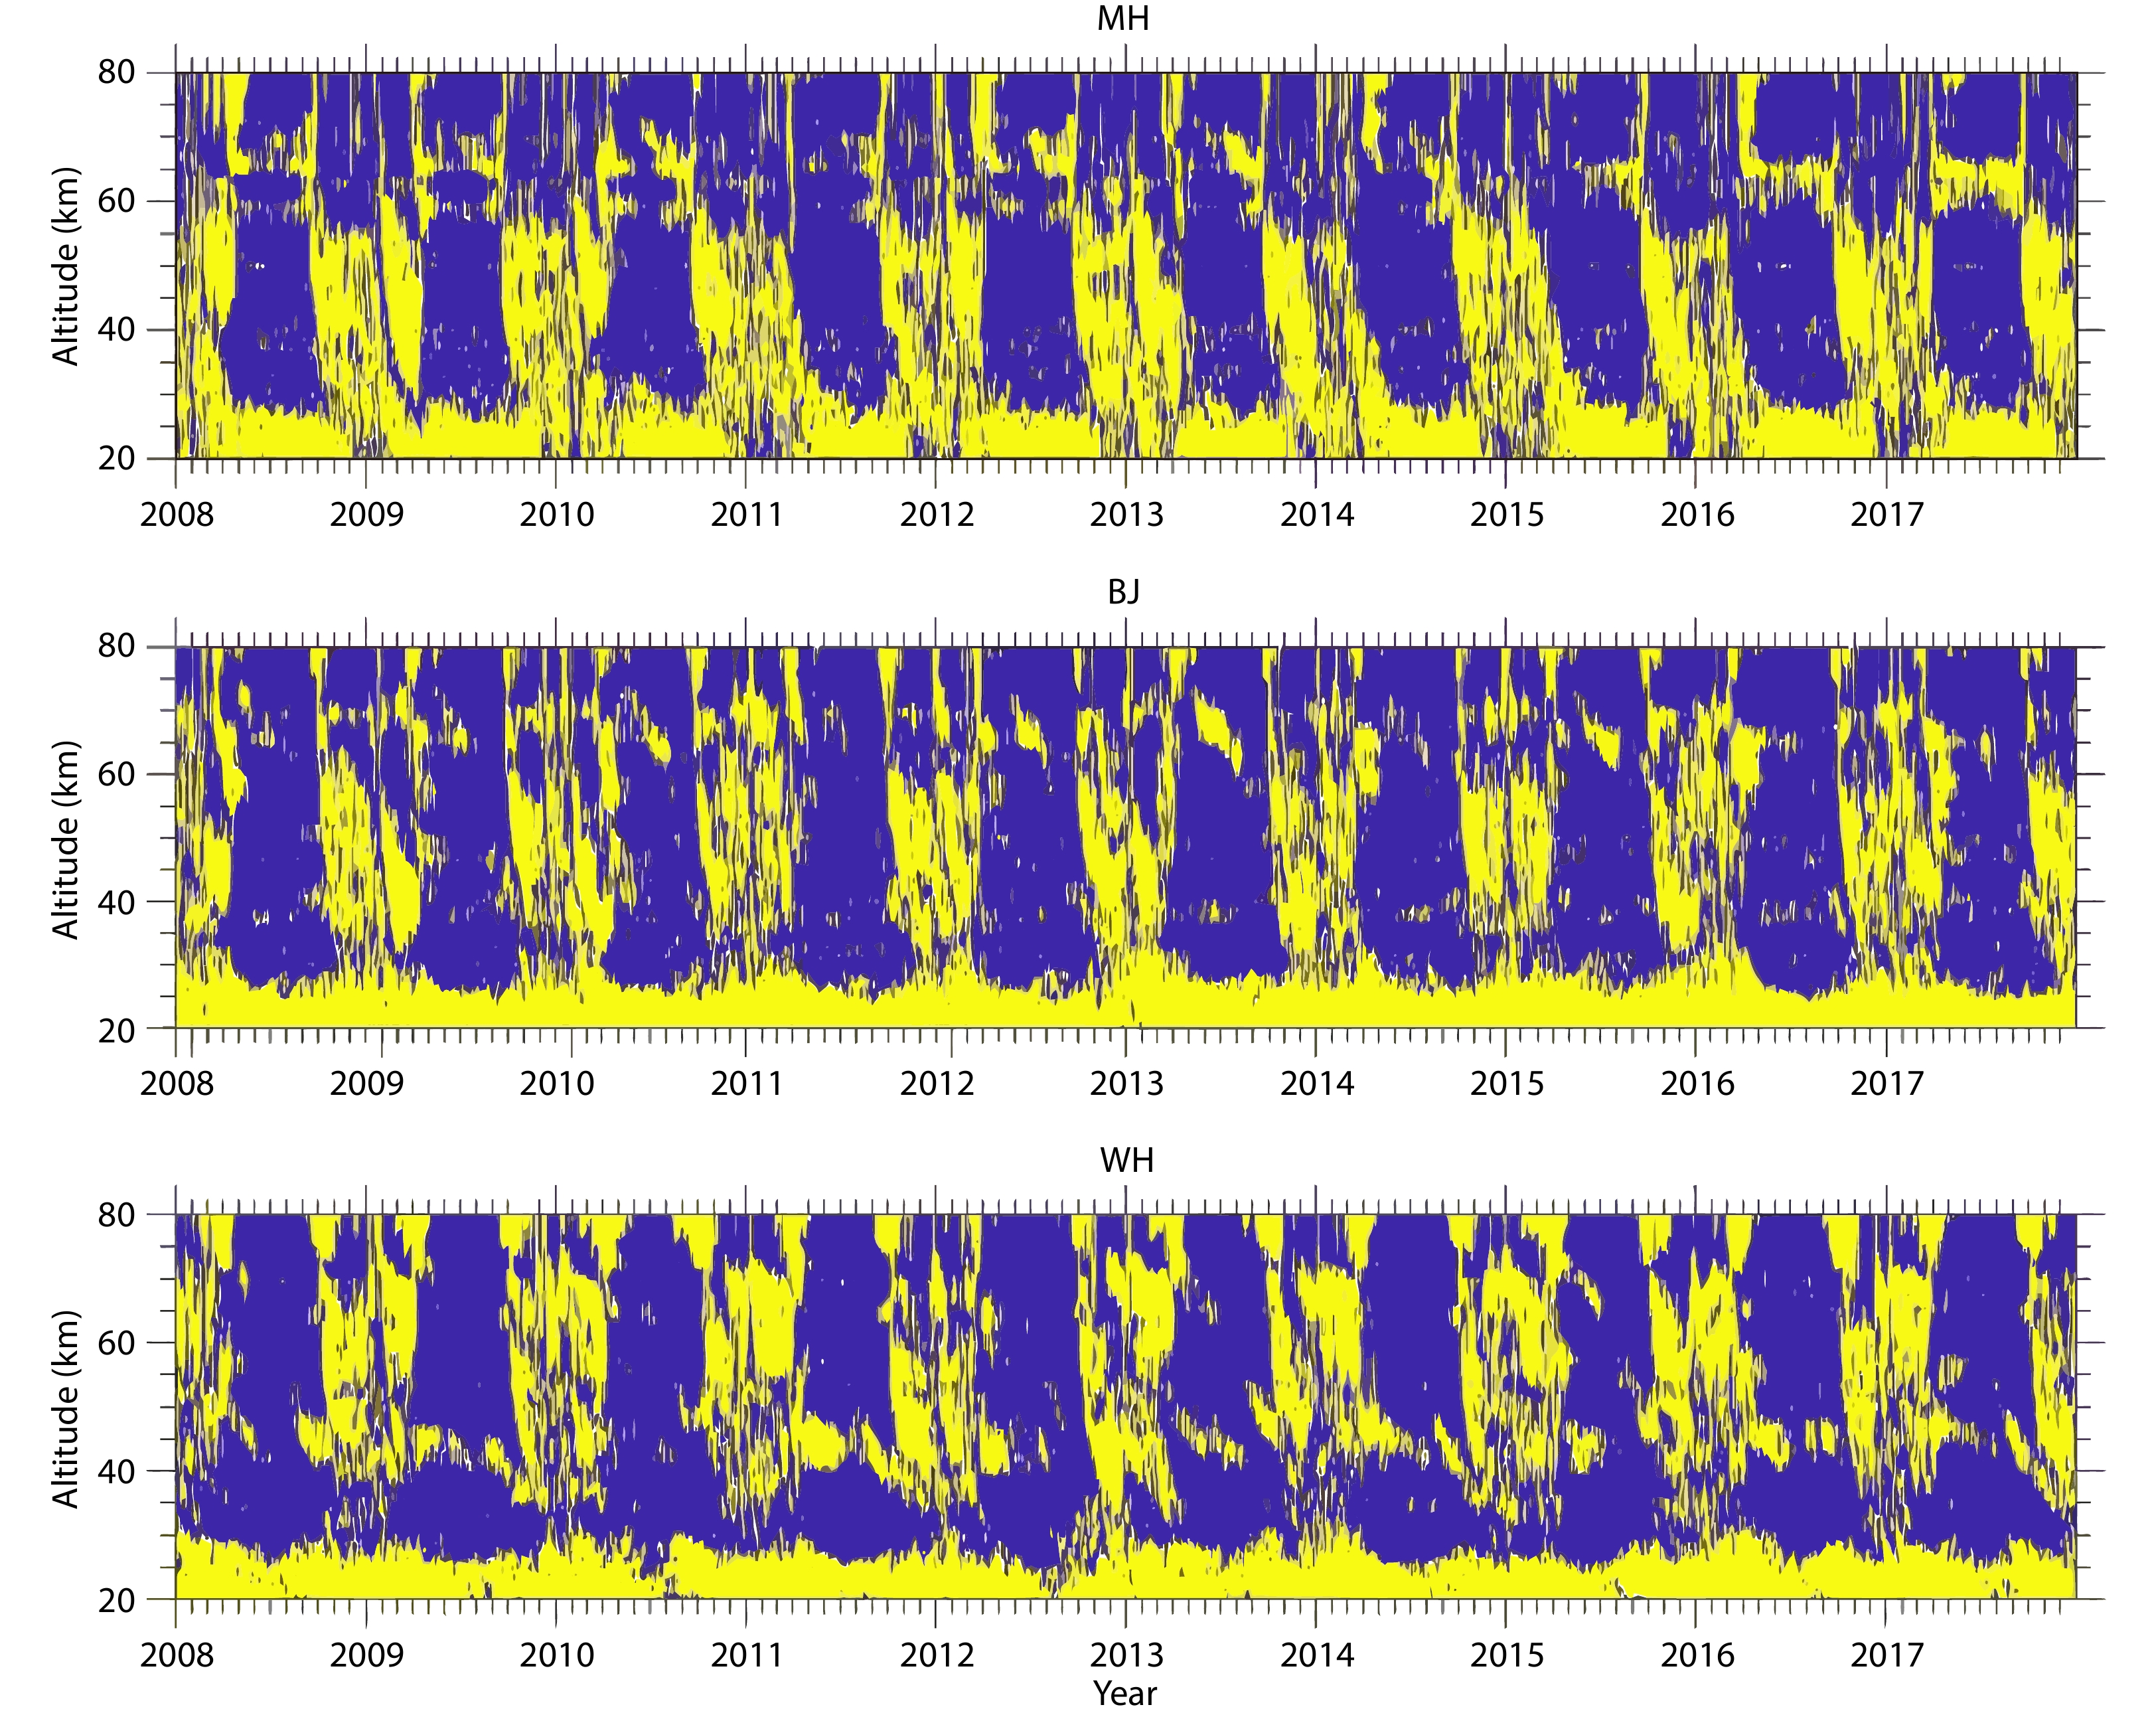
where c is the zonal phase speed and k is the zonal wavenumber. The zonal wind, meridional wind, and temperature data used for the derivation of ¯Qk,c were obtained from the MERRA2 data. The results of ¯Qk,c for MH (top), BJ (middle), and WH (bottom) ranging from ~20 to ~80 km in the period from 2008 to 2017 are presented in Figure 6. The yellow area indicates that ¯Qk,c is positive, whereas the blue region indicates that ¯Qk,c is negative.
Figure
6.
Temporal and altitudinal variations of the refractive index squared (¯Qk,c) over Mohe (MH, 53.5°N, 122.3°E), Beijing (BJ, 40.3°E, 116.2°E), and Wuhan (WH, 30.5°N, 114.6°E) from 2008 to 2017. The yellow area means ¯Qk,c is positive while the blue region indicates that ¯Qk,c is negative.
As shown in Figure 6, ¯Qk,c is largely negative from April to August at the three stations, which manifests as the Q16DWs in the troposphere being unable to propagate upward to the higher atmosphere during that time. At MH, ¯Qk,c is largely positive below 60 km during the wintertime, which indicates there are no obstacles to the propagation of Q16DWs from the troposphere to the mesosphere during winter. A critical layer seems to exist around 55–60 km that inhibits the upward wave propagation from the lower mesosphere to the MLT region a large amount of the time. Hence, excitation in the lower atmosphere and propagation upward is likely not an important mechanism of Q16DW generation in the MLT region at MH. John and Kumar (2016) proposed interhemispheric propagation as a generation mechanism of the Q16DW in the MLT region. They also analyzed the Q16DW activity in the latitude range of 50°S to 50°N and claimed that the Q16DW with wavenumber 1 has interhemispheric propagation characteristics at 80 and 100 km (John and Kumar, 2016). This may be the mechanism by which the Q16DW is generated over MH. However, further investigation is needed to better understand the excitation mechanism of the Q16DW over MH. At BJ, compared with MH, wave propagation from the troposphere to the mesosphere during winter is not as unobstructed as at MH. On the other hand, propagation from the lower mesosphere to the MLT region is easier than at MH. Around March and October, the Q16DWs in the lower atmosphere at BJ can propagate upward to the MLT region. The result of ¯Qk,c at WH is much different than that at MH. Around 30 km, ¯Qk,c is largely negative, which illustrates that it is very difficult for the waves in the troposphere and lower stratosphere at WH to propagate upward into the mesosphere. However, compared with MH, the waves at WH in the mesosphere have many fewer obstacles to propagation upward around March and October. As shown in Figure 6, the Q16DW in the MLT region likely has a limited contribution from the lower atmosphere at MH. At BJ, the Q16DW can propagate upward from the troposphere to the MLT region around March and October. At WH, the Q16DW in the MLT region has a contribution from the lower atmosphere, but the contribution is mostly from the mesosphere around March and October.
4.
Conclusions
Using three meteor radar measurements at MH (53.5°N, 122.3°E), BJ (40.3°E, 116.2°E), and WH (30.5°N, 114.6°E), in conjunction with the MLS temperature and MERRA2 reanalysis data, we investigated the Q16DW in the MLT region. We found that the amplitudes of the Q16DWs in the zonal component are generally larger than those in the meridional component at all three stations. The Q16DW activity shows significant seasonal variation, which is generally strong during winter and weak during summer. According to the MLS temperature results, W1 dominates all wave modes of the Q16DWs at the three stations in the MLT region. The seasonal variation of the Q16DWs obtained from the temperature measurements is generally consistent with that from the neutral wind measurements. However, the latitudinal variation between the two is quite different. For the ground-based measurements, the Q16DW amplitude at BJ is the most prominent among the three stations, and the wave amplitudes at MH and WH are comparable, whereas the Q16DW amplitudes in temperature decrease with a decrease in latitude.
The quasi-geostrophic refractive index squared (¯Qk,c) values at MH, BJ, and WH in the period from 2008 to 2017 in the altitude range from ~20 to ~80 km were calculated by using MERRA2 data. Our results revealed that:
(1) At MH, a mechanism that originally excited in the lower atmosphere and propagated upward was not important for the generation of the Q16DW in the MLT region;
(2) At BJ, the Q16DW in the troposphere and stratosphere could propagate upward into the MLT region, mostly around March and October;
(3) At WH, the Q16DW in the MLT region had a contribution from the lower atmosphere but mostly from the mesosphere around March and October.
Acknowledgments
The meteor radar data were provided by the Beijing National Observatory of Space Environment, IGGCAS through the Data Center for Geophysics, National Earth System Science Data Sharing Infrastructure (http://wdc.geophys.cn/). We are grateful to the MERRA data team for access to the data at https://disc.gsfc.nasa.gov/daac-bin/FTPSubset2.pl and to the Jet Propulsion Laboratory (JPL) EOS MLS science team for access to the EOS Aura MLS data at https://disc.gsfc.nasa.gov/datasets?page=1andkeywords=ML2T_004. This study was supported by the National Natural Science Foundation of China (through grants 41574142 and 41531070) and the National Science Foundation (through grant AGS-1744033). We acknowledge the use of radar data from the Chinese Meridian Project.
Andrews, D. G., Holton, J. R., and Leovy, C. B. (1987). Middle Atmosphere Dynamics. London: Academic Press.
Araújo, L. R., Lima, L. M., Batista, P. P., Clemesha, B. R., and Takahashi, H. (2014). Planetary wave seasonality from meteor wind measurements at 7.4°S and 22.7°S. Ann. Geophys., 32(5), 519–531. https://doi.org/10.5194/angeo-32-519-2014
Charney, J. G., and Drazin, P. G. (1961). Propagation of planetary-scale disturbances from the lower into the upper atmosphere. J. Geophys. Res., 66(1), 83–109. https://doi.org/10.1029/JZ066i001p00083
Day, K. A., Hibbins, R. E., and Mitchell, N. J. (2011). Aura MLS observations of the westward-propagating s=1, 16-day planetary wave in the stratosphere, mesosphere and lower thermosphere. Atmos. Chem. Phys., 11(9), 4149–4161. https://doi.org/10.5194/acp-11-4149-2011
Day, K. A., Taylor, M. J., and Mitchell, N. J. (2012). Mean winds, temperatures and the 16- and 5-day planetary waves in the mesosphere and lower thermosphere over Bear Lake Observatory (42° N, 111° W). Atmos. Chem. Phys., 12(3), 1571–1585. https://doi.org/10.5194/acp-12-1571-2012
Espy, P. J., Stegman, J., and Witt, G. (1997). Interannual variations of the quasi-16-day oscillation in the polar summer mesospheric temperature. J. Geophys. Res.: Atmos., 102(D2), 1983–1990. https://doi.org/10.1029/96JD02717
Forbes, J. M., Hagan, M. E., Miyahara, S., Vial, F., Manson, A. H., Meek, C. E., and Portnyagin, Y. I. (1995). Quasi 16-day oscillation in the mesosphere and lower thermosphere. J. Geophys. Res.: Atmos., 100(D5), 9149–9163. https://doi.org/10.1029/94JD02157
Gan, Q., Yue, J., Chang, L. C., Wang, W. B., Zhang, S. D., and Du, J. (2015). Observations of thermosphere and ionosphere changes due to the dissipative 6.5-day wave in the lower thermosphere. Ann. Geophys., 33(7), 913–922. https://doi.org/10.5194/angeo-33-913-2015
Gong, Y., Li, C., Ma, Z., Zhang, S. D., Zhou, Q. H., Huang, C. M., Huang, K. M., Li, G. Z., and Ning, B. Q. (2018). Study of the quasi-5-day wave in the MLT region by a meteor radar chain. J. Geophys. Res.: Atmos., 123(17), 9474–9487. https://doi.org/10.1029/2018JD029355
Gong, Y., Wang, H. L., Ma, Z., Zhang, S. D., Zhou, Q. H., Huang, C. M., and Huang, K. M. (2019). A statistical analysis of the propagating quasi 16-day waves at high latitudes and their response to sudden stratospheric warmings from 2005 to 2018. J. Geophys. Res.: Atmos., 124(23), 12617–12630. https://doi.org/10.1029/2019JD031482
Guharay, A., Prado Batista, P., Clemesha, B. R., Buriti, R. A., and Schuch, N. J. (2016). Latitudinal variability of the quasi-16-day wave in the middle atmosphere over Brazilian stations. Ann. Geophys., 34(4), 411–419. https://doi.org/10.5194/angeo-34-411-2016
Hocking, W. K., Fuller, B., and Vandepeer, B. (2001). Real-time determination of meteor-related parameters utilizing modern digital technology. J. Atmos. Sol.-Terr. Phys., 63(2-3), 155–169. https://doi.org/10.1016/S1364-6826(00)00138-3
Huang, C. M., Zhang, S. D., Chen, G., Zhang, S. Y., and Huang, K. M. (2017). Planetary wave characteristics in the lower atmosphere over Xianghe (117.00°E, 39.77°N), China, revealed by the Beijing MST radar and MERRA data. J. Geophys. Res.: Atmos., 122(18), 9745–9758. https://doi.org/10.1002/2017JD027029
Huang, Y. Y., Zhang, S. D., Li, C. Y., Li, H. J., Huang, K., and Huang, C. M. (2017). Annual and interannual variations in global 6.5DWs from 20–110 km during 2002–2016 observed by TIMED/SABER. J. Geophys. Res.: Space Phys., 122(8), 8985–9002. https://doi.org/10.1002/2017JA023886
Jacobi, C., Schminder, R., and Kürschner, D. (1998a). Planetary wave activity obtained from long-period (2–18 days) variations of mesopause region winds over Central Europe (52°N, 15°E). J. Atmos. Sol.-Terr. Phys., 60(1), 81–93. https://doi.org/10.1016/S1364-6826(97)00117-X
Jacobi, C., Schminder, R., and Kürschner, D. (1998b). Long-period (12–25 days) oscillations in the summer mesopause region as measured at Collm (52°N, 15°E) and their dependence on the equatorial quasi-biennial oscillation. Contrib. Atmos. Phys., 71(4), 461–464.
Jiang, G. Y., Xiong, J. G., Wan, W. X., Ning, B. Q., Liu, L. B., Vincent, R. A., and Reid, I. (2005). The 16-day waves in the mesosphere and lower thermosphere over Wuhan (30.6°N, 114.5°E) and Adelaide (35°S, 138°E). Adv. Space Res., 35(11), 2005–2010. https://doi.org/10.1016/j.asr.2005.03.011
John, S. R., and Kumar, K. K. (2016). Global normal mode planetary wave activity: a study using TIMED/SABER observations from the stratosphere to the mesosphere-lower thermosphere. Climate Dyn., 47(12), 3863–3881. https://doi.org/10.1007/s00382-016-3046-2
Kingsley, S. P., Muller, H. G., Nelson, L., and Scholefield, A. (1978). Meteor winds over Sheffield (53°N, 2°W). J. Atmos. Terr. Phys., 40(8), 917–922. https://doi.org/10.1016/0021-9169(78)90143-5
Kishore, P., Namboothiri, S. P., Igarashi, K., Gurubaran, S., Sridharan, S., Rajaram, R., and Ratnam, M. V. (2004). MF radar observations of 6.5-day wave in the equatorial mesosphere and lower thermosphere. J. Atmos. Sol.-Terr. Phys., 66(6-9), 507–515. https://doi.org/10.1016/j.jastp.2004.01.026
Li, G. Z., Ning, B. Q., Hu, L. H., Chu, Y. H., Reid, I. M., and Dolman, B. K. (2012). A comparison of lower thermospheric winds derived from range spread and specular meteor trail echoes. J. Geophys. Res. Space Phys., 117(A3), A03310. https://doi.org/10.1029/2011JA016847
Lima, L. M., Batista, P. P., Clemesha, B. R., and Takahashi, H. (2006). 16-day wave observed in the meteor winds at low latitudes in the southern hemisphere. Adv. Space Res., 38(11), 2615–2620. https://doi.org/10.1016/j.asr.2006.03.033
Livesey, N. J., Read, W. G., Wagner, P. A., Froidevaux, L., Lambert, A., Manney, G. L., Valle, L. F., Pumphrey, H. C., Santee, M. L., … Lay, R. R. (2017). EOS MLS version 4.2x Level 2 data quality and description document. Jet Propulsion Laboratory, California Institution of Technology, https://mls.jpl.nasa.gov/data/v4-2_data_quality_document.pdf
Luo, Y., Manson, A. H., Meek, C. E., Meyer, C. K., and Forbes, J. M. (2000). The quasi 16-day oscillations in the mesosphere and lower thermosphere at Saskatoon (52°N, 107°W), 1980–1996. J. Geophys. Res.: Atmos., 105(D2), 2125–2138. https://doi.org/10.1029/1999JD900979
Luo, Y., Manson, A. H., Meek, C. E., Thayaparan, T., MacDougall, J., and Hocking, W. K. (2002a). The 16-day wave in the mesosphere and lower thermosphere: simultaneous observations at Saskatoon (52°N, 107°W) and London (43°N, 81°W), Canada. J. Atmos. Sol.-Terr. Phys., 64(8–11), 1287–1307. https://doi.org/10.1016/S1364-6826(02)00042-1
Luo, Y., Manson, A. H., Meek, C. E., Meyer, C. K., Burrage, M. D., Fritts, D. C., Hall, C. M., Hocking, W. K., MacDougall, J., … Vincent, R. A. (2002b). The 16-day planetary waves: multi-mf radar observations from the arctic to equator and comparisons with the HRDI measurements and the GSWM modelling results. Ann. Geophys., 20(5), 691–709. https://doi.org/10.5194/angeo-20-691-2002
Ma, Z., Gong, Y., Zhang, S. D., Zhou, Q. H., Huang, C. M., Huang, K. M., Yu, Y., Li, G. Z., Ning, B. Q., and Li, C. (2017). Responses of quasi 2 day waves in the MLT region to the 2013 SSW revealed by a meteor radar chain. Geophys. Res. Lett., 44(18), 9142–9150. https://doi.org/10.1002/2017GL074597
Ma, Z., Gong, Y., Zhang, S. D., Zhou, Q. H., Huang, C. M., Huang, K. M., Dong, W. J., Li, G. Z., and Ning, B. Q. (2018). Study of mean wind variations and gravity wave forcing via a meteor radar chain and comparison with HWM-07 results. J. Geophys. Res.: Atmos., 123(17), 9488–9501. https://doi.org/10.1029/2018JD028799
Malinga, S. B., and Poole, L. M. G. (2002a). The 16-day variation in the mean flow at Grahamstown (33.3° S, 26.5° E). Ann. Geophys., 20(12), 2027–2031. https://doi.org/10.5194/angeo-20-2027-2002
Malinga, S. B., and Poole, L. M. G. (2002b). The 16-day variation in tidal amplitudes at Grahamstown (33.3° S, 26.5° E). Ann. Geophys., 20(12), 2033–2038. https://doi.org/10.5194/angeo-20-2033-2002
Manson, A. H., and Meek, C. E. (1986). Dynamics of the middle atmosphere at Saskatoon (52°N, 107°W): A spectral study during 1981, 1982. J. Atmos. Sol.-Terr. Phys., 48(11–12), 1039–1055. https://doi.org/10.1016/0021-9169(86)90025-5
Manson, A. H., Meek, C. E., Chshyolkova, T., Avery, S. K., Thorsen, D., MacDougall, J. W., Hocking, W., Murayama, Y., Igarashi, K., … Kishore, P. (2004). Longitudinal and latitudinal variations in dynamic characteristics of the MLT (70–95 km): a study involving the CUJO network. Ann. Geophys., 22(2), 347–365. https://doi.org/10.5194/angeo-22-347-2004
McDonald, A. J., Hibbins, R. E., and Jarvis, M. J. (2011). Properties of the quasi 16 day wave derived from EOS MLS observations. J. Geophys. Res. Atmos., 116(D6), D06112. https://doi.org/10.1029/2010JD014719
Mitchell, N. J., Middleton, H. R., Beard, A. G., Williams, P. J. S., and Muller, H. G. (1999). The 16-day planetary wave in the mesosphere and lower thermosphere. Ann. Geophys., 17(11), 1447–1456. https://doi.org/10.1007/s00585-999-1447-9
Miyoshi, Y. (1999). Numerical simulation of the 5-day and 16-day waves in the mesopause region. Earth Planets Space, 51(7-8), 763–772. https://doi.org/10.1186/BF03353235
Molod, A., Takacs, L., Suarez, M., and Bacmeister, J. (2015). Development of the GEOS-5 atmospheric general circulation model: evolution from MERRA to MERRA2. Geosci. Model Dev., 8(5), 1339–1356. https://doi.org/10.5194/gmd-8-1339-2015
Namboothiri, S. P., Kishore, P., and Igarashi, K. (2002). Climatological studies of the quasi 16-day oscillations in the mesosphere and lower thermosphere at Yamagawa (31.2°N, 130.6°E). Japan. Ann. Geophys., 20(8), 1239–1246. https://doi.org/10.5194/angeo-20-1239-2002
Pancheva, D. V., Mukhtarov, P. J., Mitchell, N. J., Fritts, D. C., Riggin, D. M., Takahashi, H., Batista, P. P., Clemesha, B. R., Gurubaran, S., and Ramkumar, G. (2008). Planetary wave coupling (5-6-day waves) in the low-latitude atmosphere-ionosphere system. J. Atmos. Sol.-Terr. Phys., 70(1), 101–122. https://doi.org/10.1016/j.jastp.2007.10.003
Randel, W. J. (1988). The seasonal evolution of planetary-waves in the Southern-Hemisphere stratosphere and troposphere. Q. J. R. Meteorol. Soc., 114(484), 1385–1409. https://doi.org/10.1002/qj.49711448403
Riggin, D. M., Liu, H. L., Lieberman, R. S., Roble, R. G., Russell III, J. M., Mertens, C. J., Mlynczak, M. G., Pancheva, D., Franke, S. J., … Vincent, R. A. (2006). Observations of the 5-day wave in the mesosphere and lower thermosphere. J. Atmos. Sol.-Terr. Phys., 68(3-5), 323–339. https://doi.org/10.1016/j.jastp.2005.05.010
Salby, M. L. (1981a). Rossby normal modes in nonuniform background configurations. Part I: Simple fields. J. Atmos. Sci., 38(9), 1803–1826. https://doi.org/10.1175/1520-0469(1981)038<1803:RNMINB>2.0.CO;2 doi: 10.1175/1520-0469(1981)038<1803:RNMINB>2.0.CO;2
Salby, M. L. (1981b). Rossby normal modes in nonuniform background configurations. Part II. Equinox and solstice conditions. J. Atmos. Sci., 38(9), 1827–1840. https://doi.org/10.1175/1520-0469(1981)038<1827:RNMINB>2.0.CO;2 doi: 10.1175/1520-0469(1981)038<1827:RNMINB>2.0.CO;2
Schwartz, M. J., Lambert, A., Manney, G. L., Read, W. G., Livesey, N. J., Froidevaux, L., Ao, C. O., Bernath, P. F., Boone, C. D., … Wu, D. L. (2008). Validation of the Aura Microwave Limb Sounder temperature and geopotential height measurements. J. Geophys. Res. Atmos., 113(D15), D15S11. https://doi.org/10.1029/2007JD008783
Smith, A. K. (2003). The origin of stationary planetary waves in the upper mesosphere. J. Atmos. Sci., 60(24), 3033–3041. https://doi.org/10.1175/1520-0469(2003)060<3033:toospw>2.0.co;2 doi: 10.1175/1520-0469(2003)060<3033:toospw>2.0.co;2
Takahashi, H., Shiokawa, K., Egito, F., Murayama, Y., Kawamura, S., and Wrasse, C. M. (2013). Planetary wave induced wind and airglow oscillations in the middle latitude MLT region. J. Atmos. Sol.-Terr. Phys., 98, 97–104. https://doi.org/10.1016/j.jastp.2013.03.014
Wang, J. Y., Yi, W., Chen, T. D., and Xue, X. H. (2020). Quasi-6-day waves in the mesosphere and lower thermosphere region and their possible coupling with the QBO and solar 27-day rotation. Earth Planet. Phys., 4(3), 1–11.
Waters, J. W., Froidevaux, L., Harwood, R. S., Jarnot, R. F., Pickett, H. M., Read, W. G., Siegel, P. H., Cofield, R. E., Filipiak, M. J., … Dodge, R. (2006). The Earth Observing System Microwave Limb Sounder (EOS MLS) on the Aura satellite. IEEE Trans. Geosci. Remote Sens., 44(5), 1075–1092. https://doi.org/10.1109/TGRS.2006.873771
Williams, C. R., and Avery, S. K. (1992). Analysis of long-period waves using the mesosphere-stratosphere-troposphere radar at Poker Flat, Alaska. J. Geophys. Res.: Atmos., 97(D18), 20855–20861. https://doi.org/10.1029/92JD02052
Wu, D. L., Hays, P. B., and Skinner, W. R. (1995). A least squares method for spectral analysis of space-time series. J. Atmos. Sci., 52(20), 3501–3511. https://doi.org/10.1175/1520-0469(1995)052<3501:alsmfs>2.0.co;2 doi: 10.1175/1520-0469(1995)052<3501:alsmfs>2.0.co;2
Yu, Y., Wan, W. X., Ning, B. Q., Liu, L. B., Wang, Z. G., Hu, L. H., and Ren, Z. P. (2013). Tidal wind mapping from observations of a meteor radar chain in December 2011. J. Geophys. Res.: Space Phys., 118(5), 2321–2332. https://doi.org/10.1029/2012JA017976


 DownLoad: