| Citation: | Gao, J. W., Rong, Z. J., Zhang, Q., Mittelholz, A., Zhang, C., and Wei, Y. (2024). Influence of upstream solar wind on magnetic field distribution in the Martian nightside ionosphere. Earth Planet. Phys., 8(5), 728–741. DOI: 10.26464/epp2024052 |
Using over eight years of Mars Atmosphere and Volatile EvolutioN (MAVEN) data, from November 2014 to May 2023, we have investigated the Martian nightside ionospheric magnetic field distribution under the influence of upstream solar wind drivers, including the interplanetary magnetic field intensity (
Approximately 3.5 billion years ago Mars was warm and habitable, with a considerably thick atmosphere (Jakosky and Phillips, 2001; Carr and Head III, 2003; Jakosky et al., 2017). Currently, the Martian atmosphere is thin; the majority of its earlier atmospheric components long ago escaped into space. It is recognized that planetary ions escape to interplanetary space through electromagnetic forces and associated particle dynamic processes (e.g., Barabash et al., 2007; Lundin, 2011; Futaana et al., 2017; Zhang C et al., 2022). Therefore, understanding in detail the magnetic field distribution in the Martian atmosphere is crucial to constrain the process of planetary particle escape and ultimately to understand the evolution of Martian habitability (e.g., Connerney et al., 2015a; Ramstad and Barabash, 2021).
Unlike Earth, Mars lacks a global dipolar magnetic field; the planet does have locally distributed crustal magnetic fields (Acuña et al., 1999; Gao JW et al., 2021; Mittelholz and Johnson, 2022). Mars is exposed to the solar wind, which carries the Interplanetary Magnetic Field (IMF) that interacts with Mars’ highly conductive ionosphere, resulting in an induced magnetosphere (Luhman et al., 2004). The IMF drapes around the ionospheric obstacle, appears “hung up” in the dayside, and is stretched by the solar wind to form an induced magnetotail (e.g., Luhmann et al., 2004; Brain et al., 2017).
Over the past two decades, NASA’s Mars Global Surveyor (MGS) and the Mars Atmosphere and Volatile EvolutioN (MAVEN) spacecraft have extensively measured the Martian magnetic field at atmospheric altitudes. The MGS spacecraft, providing the first comprehensive magnetic field measurements at Mars, mainly sampled at an altitude of 400 km. The Martian magnetic field comprises both induced and crustal magnetic fields (Connerney et al., 1999; Brain et al., 2003). At the nightside, it has been determined that the predominant contributor to the weak external magnetic field is the draping of the IMF, which can extend to about 400 km altitude (Ferguson et al., 2005; Mittelholz et al., 2017). These findings suggest the presence of a magnetotail-like feature down to ionospheric altitudes on Mars’ nightside (Ferguson et al., 2005). However, MGS was unable to measure the induced magnetic field at such lower altitudes as 100−200 km. In 2014, the MAVEN mission became the first spacecraft to routinely measure low-altitude Martian magnetic fields at varying local times. Analysis of MAVEN data revealed that the penetration of the draped magnetic field into the dayside Martian ionosphere can reach down to 150−200 km altitude (Fowler et al., 2019; Huang JP et al., 2023; Fang XH et al., 2023). When draped magnetic field lines penetrate into atmospheric altitudes, they create a planetary escape channel for charged ionospheric particles (Xu SS et al., 2017; Fowler et al., 2019; Shuvalov et al., 2024).
An intriguing aspect of this emerging scenario is the question: How do variations in upstream solar wind conditions impact the topology of the low-altitude induced magnetic field on Mars (Brain et al., 2020; Fang XH et al., 2023; Fowler et al., 2024)? The induced field topology exhibits statistical variation in response to solar conditions, such as the IMF’s strength and direction, solar wind dynamic pressure (
Here, we present a statistical analysis based on over eight years of magnetic field observations from the MAVEN mission, spanning from November 2014 to May 2023, to investigate the impact of solar conditions on the external magnetic field distribution in the Martian nightside ionosphere. Our study focuses primarily on how various solar conditions affect the penetration depth of the IMF into the nightside ionosphere. The aims of this study are to enhance our understanding of the magnetic field environment under varying solar conditions. Moreover, this study can also provide important constraints on removing the influence of external fields in order to improve accurate modeling of Mars’ internal, crustal magnetic field. In Section 2, we provide an overview of the MAVEN dataset and the coordinate system utilized. Section 3 presents our findings; conclusions and discussion appear in Section 4.
This study utilizes MAVEN magnetic field and plasma measurements (Jakosky et al., 2015). Launched in September 2014, MAVEN orbits Mars in an elliptical trajectory with initial periapsis and apoapsis altitudes of 150 km and 6000 km, respectively. The apoapsis altitude was adjusted to 4400 km after an aerobraking maneuver in 2019. At ionospheric altitudes, MAVEN spans from 150 km to 600 km at all local times; it also can collect limited lower altitude data down to 110 km. Magnetic field data were measured by the fluxgate magnetometers (MAG) aboard MAVEN, with the vector magnetic field data being resampled at 4 s intervals to filter out high-frequency wave signals (Connerney et al., 2015b). Upstream solar wind velocity and density were measured by the Solar Wind Ion Analyzer (SWIA) instrument, which measures ion fluxes within an energy range of 25 eV to 25 keV, with a time resolution of 4 s (Halekas et al., 2015).
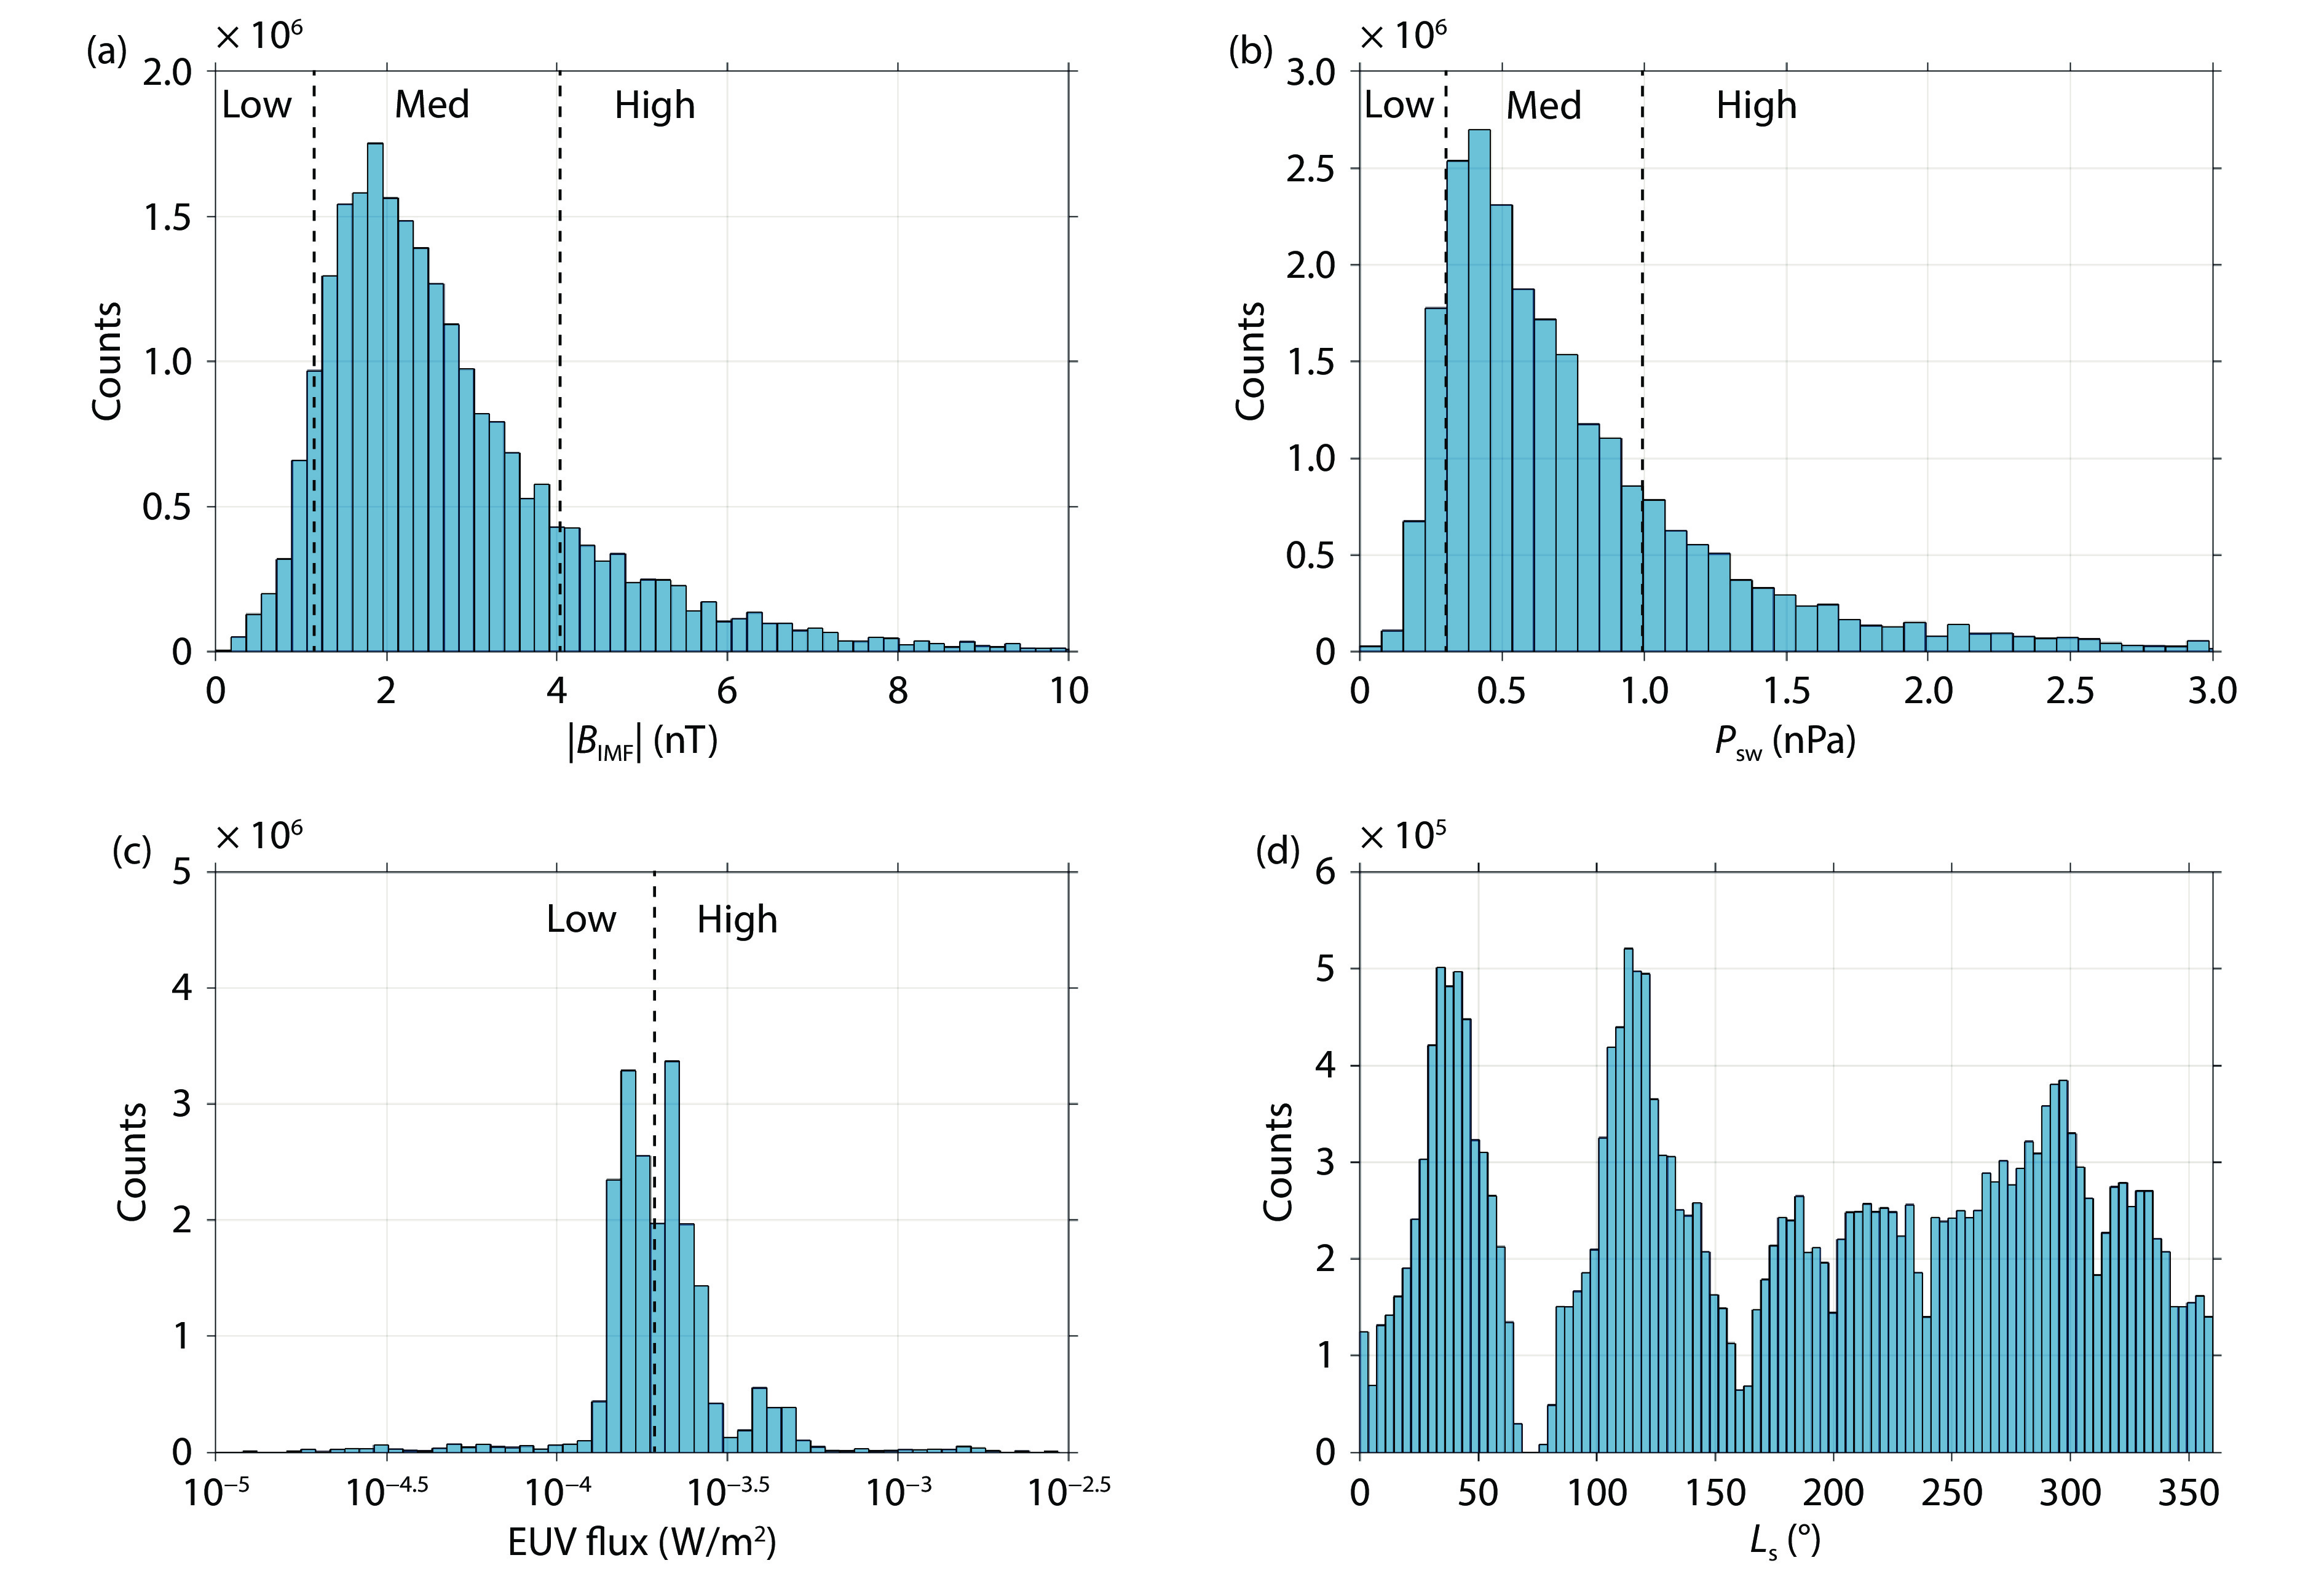
To evaluate upstream solar wind conditions for each orbit, orbits were chosen when MAVEN was adequately distant from the Martian bow shock, specifically when the apoapsis was positioned 0.3
In this study, the magnetic field is analyzed in the Mars−Solar−Orbital (MSO) coordinate system, where
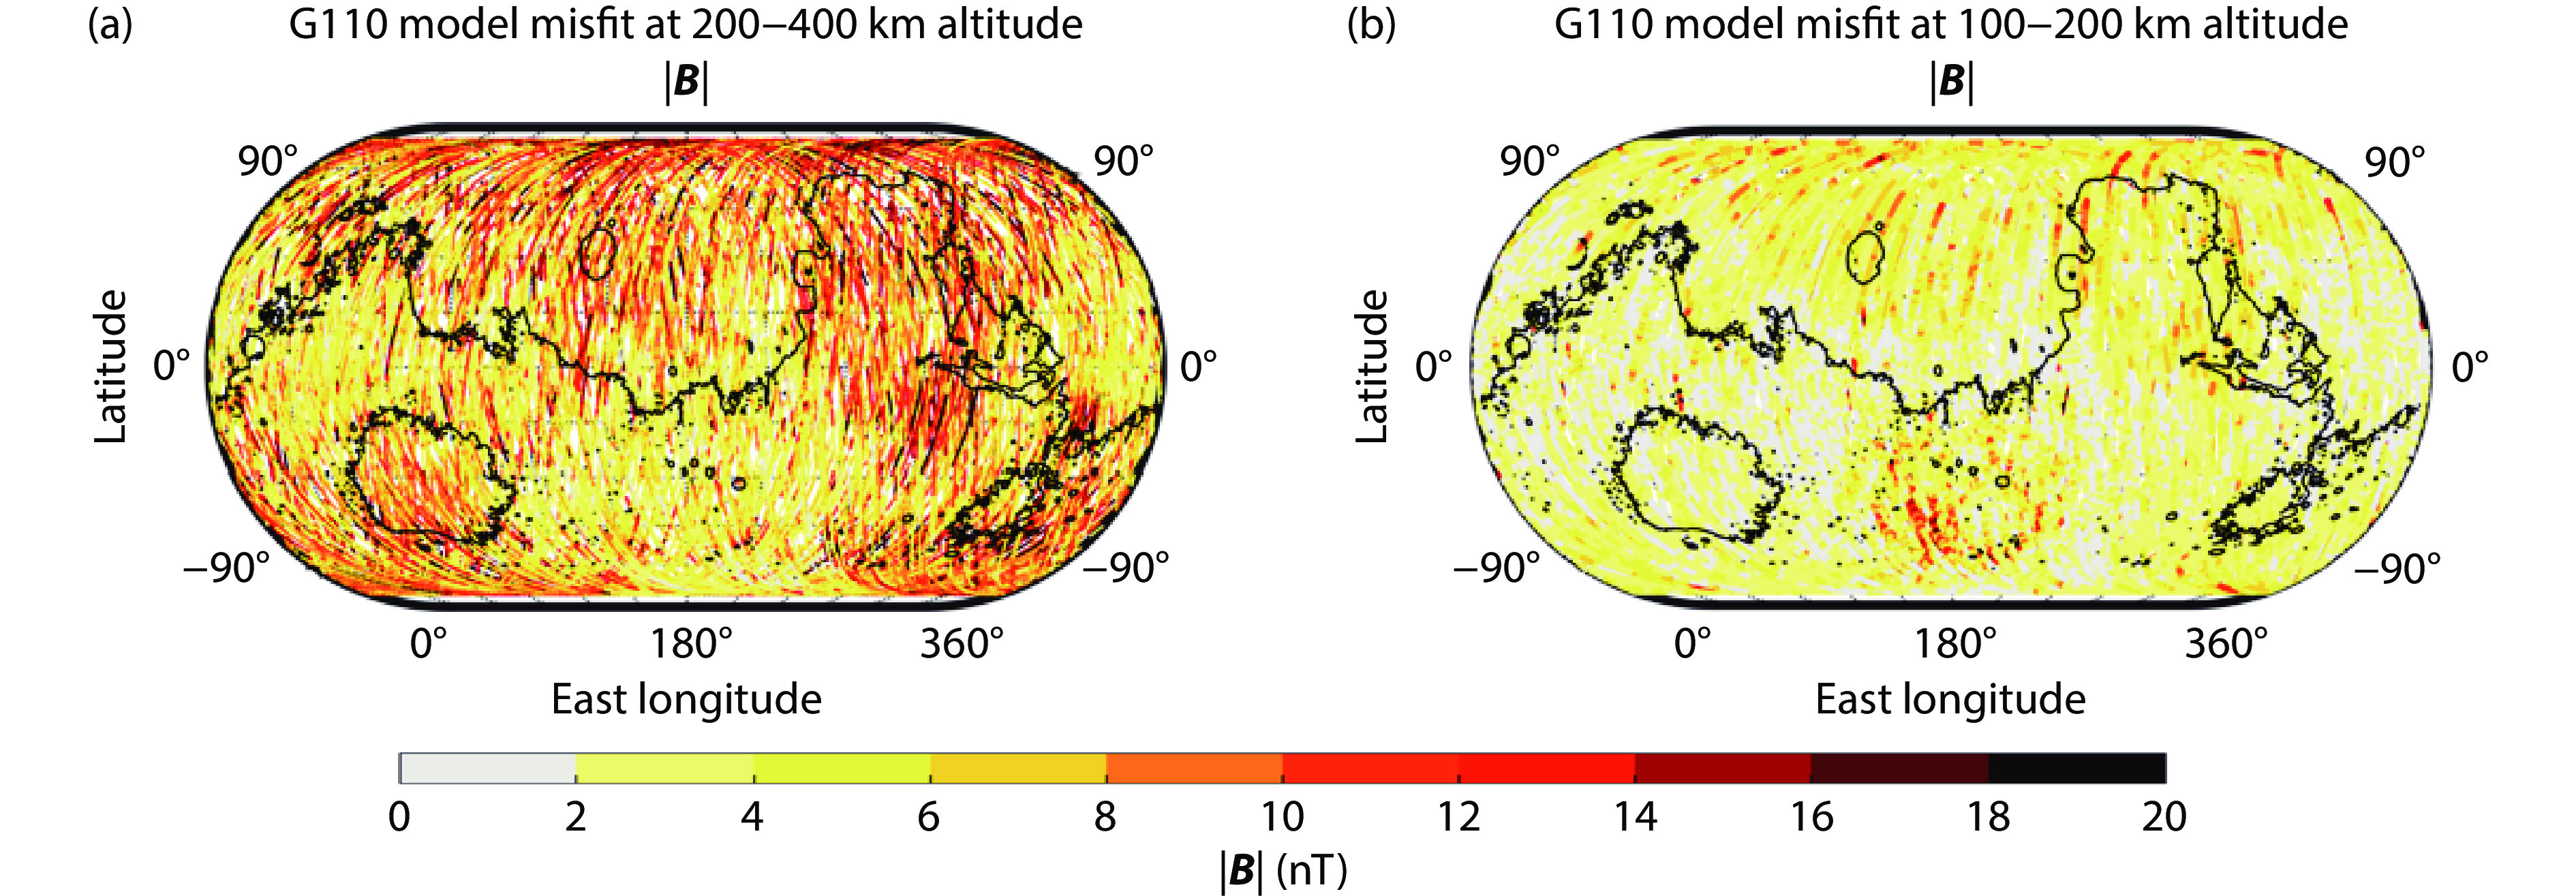
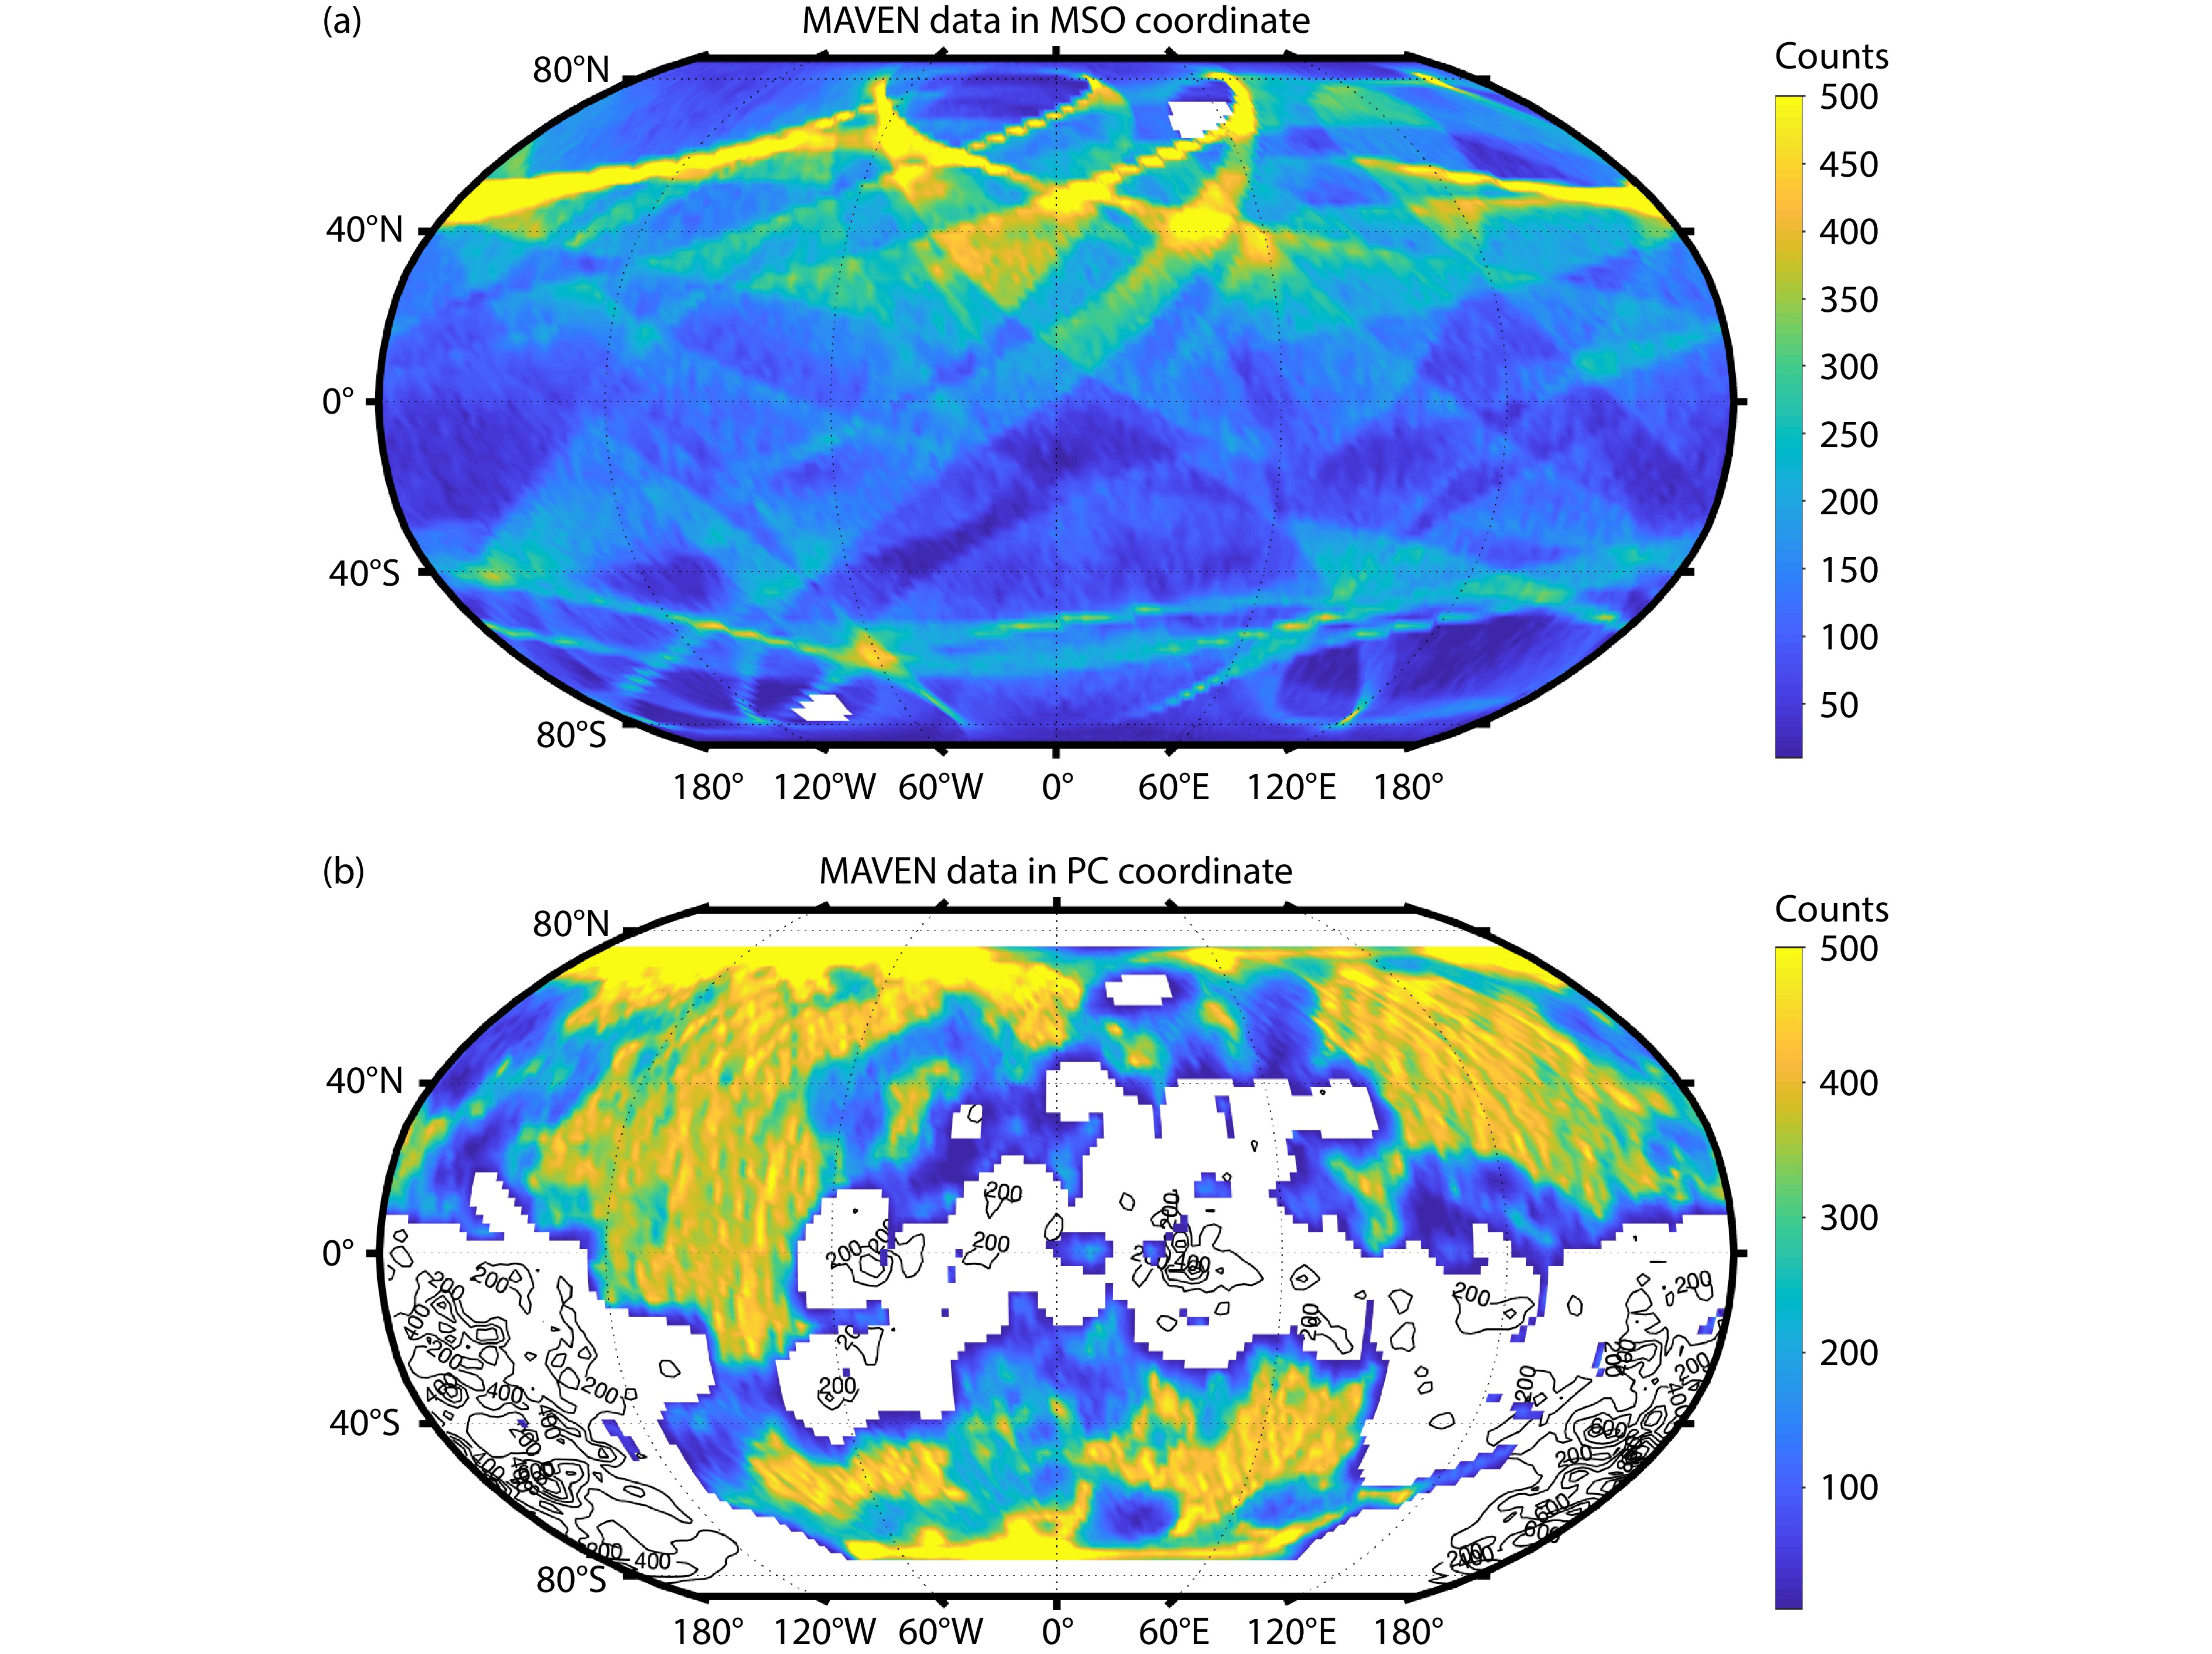
Magnetic field residuals were further determined by subtracting a crustal field model from the observed magnetic field measurements (Gao JW et al., 2021). These residuals are interpreted as magnetic field contributions driven by the IMF and ionosphere. Figure 2 demonstrates that, within the MAVEN data set, the residuals of the G110 model at altitudes of 200–400 km are more pronounced in regions with weak crustal fields than in those with strong crustal fields (Gao JW et al., 2021). This distribution suggests that the residuals are influenced predominantly by external magnetic fields rather than internal magnetic fields. Consequently, these magnetic field residuals can be considered as reflective of the external magnetic field. While this method substantially mitigates the direct influence of the crustal field on the external magnetic field contribution, it may not fully eliminate indirect influences of ionospheric currents on the crustal field regions (Riousset et al., 2014).
We have investigated variations in the nightside magnetic field distribution in response to four distinct upstream drivers: the intensity of the IMF (
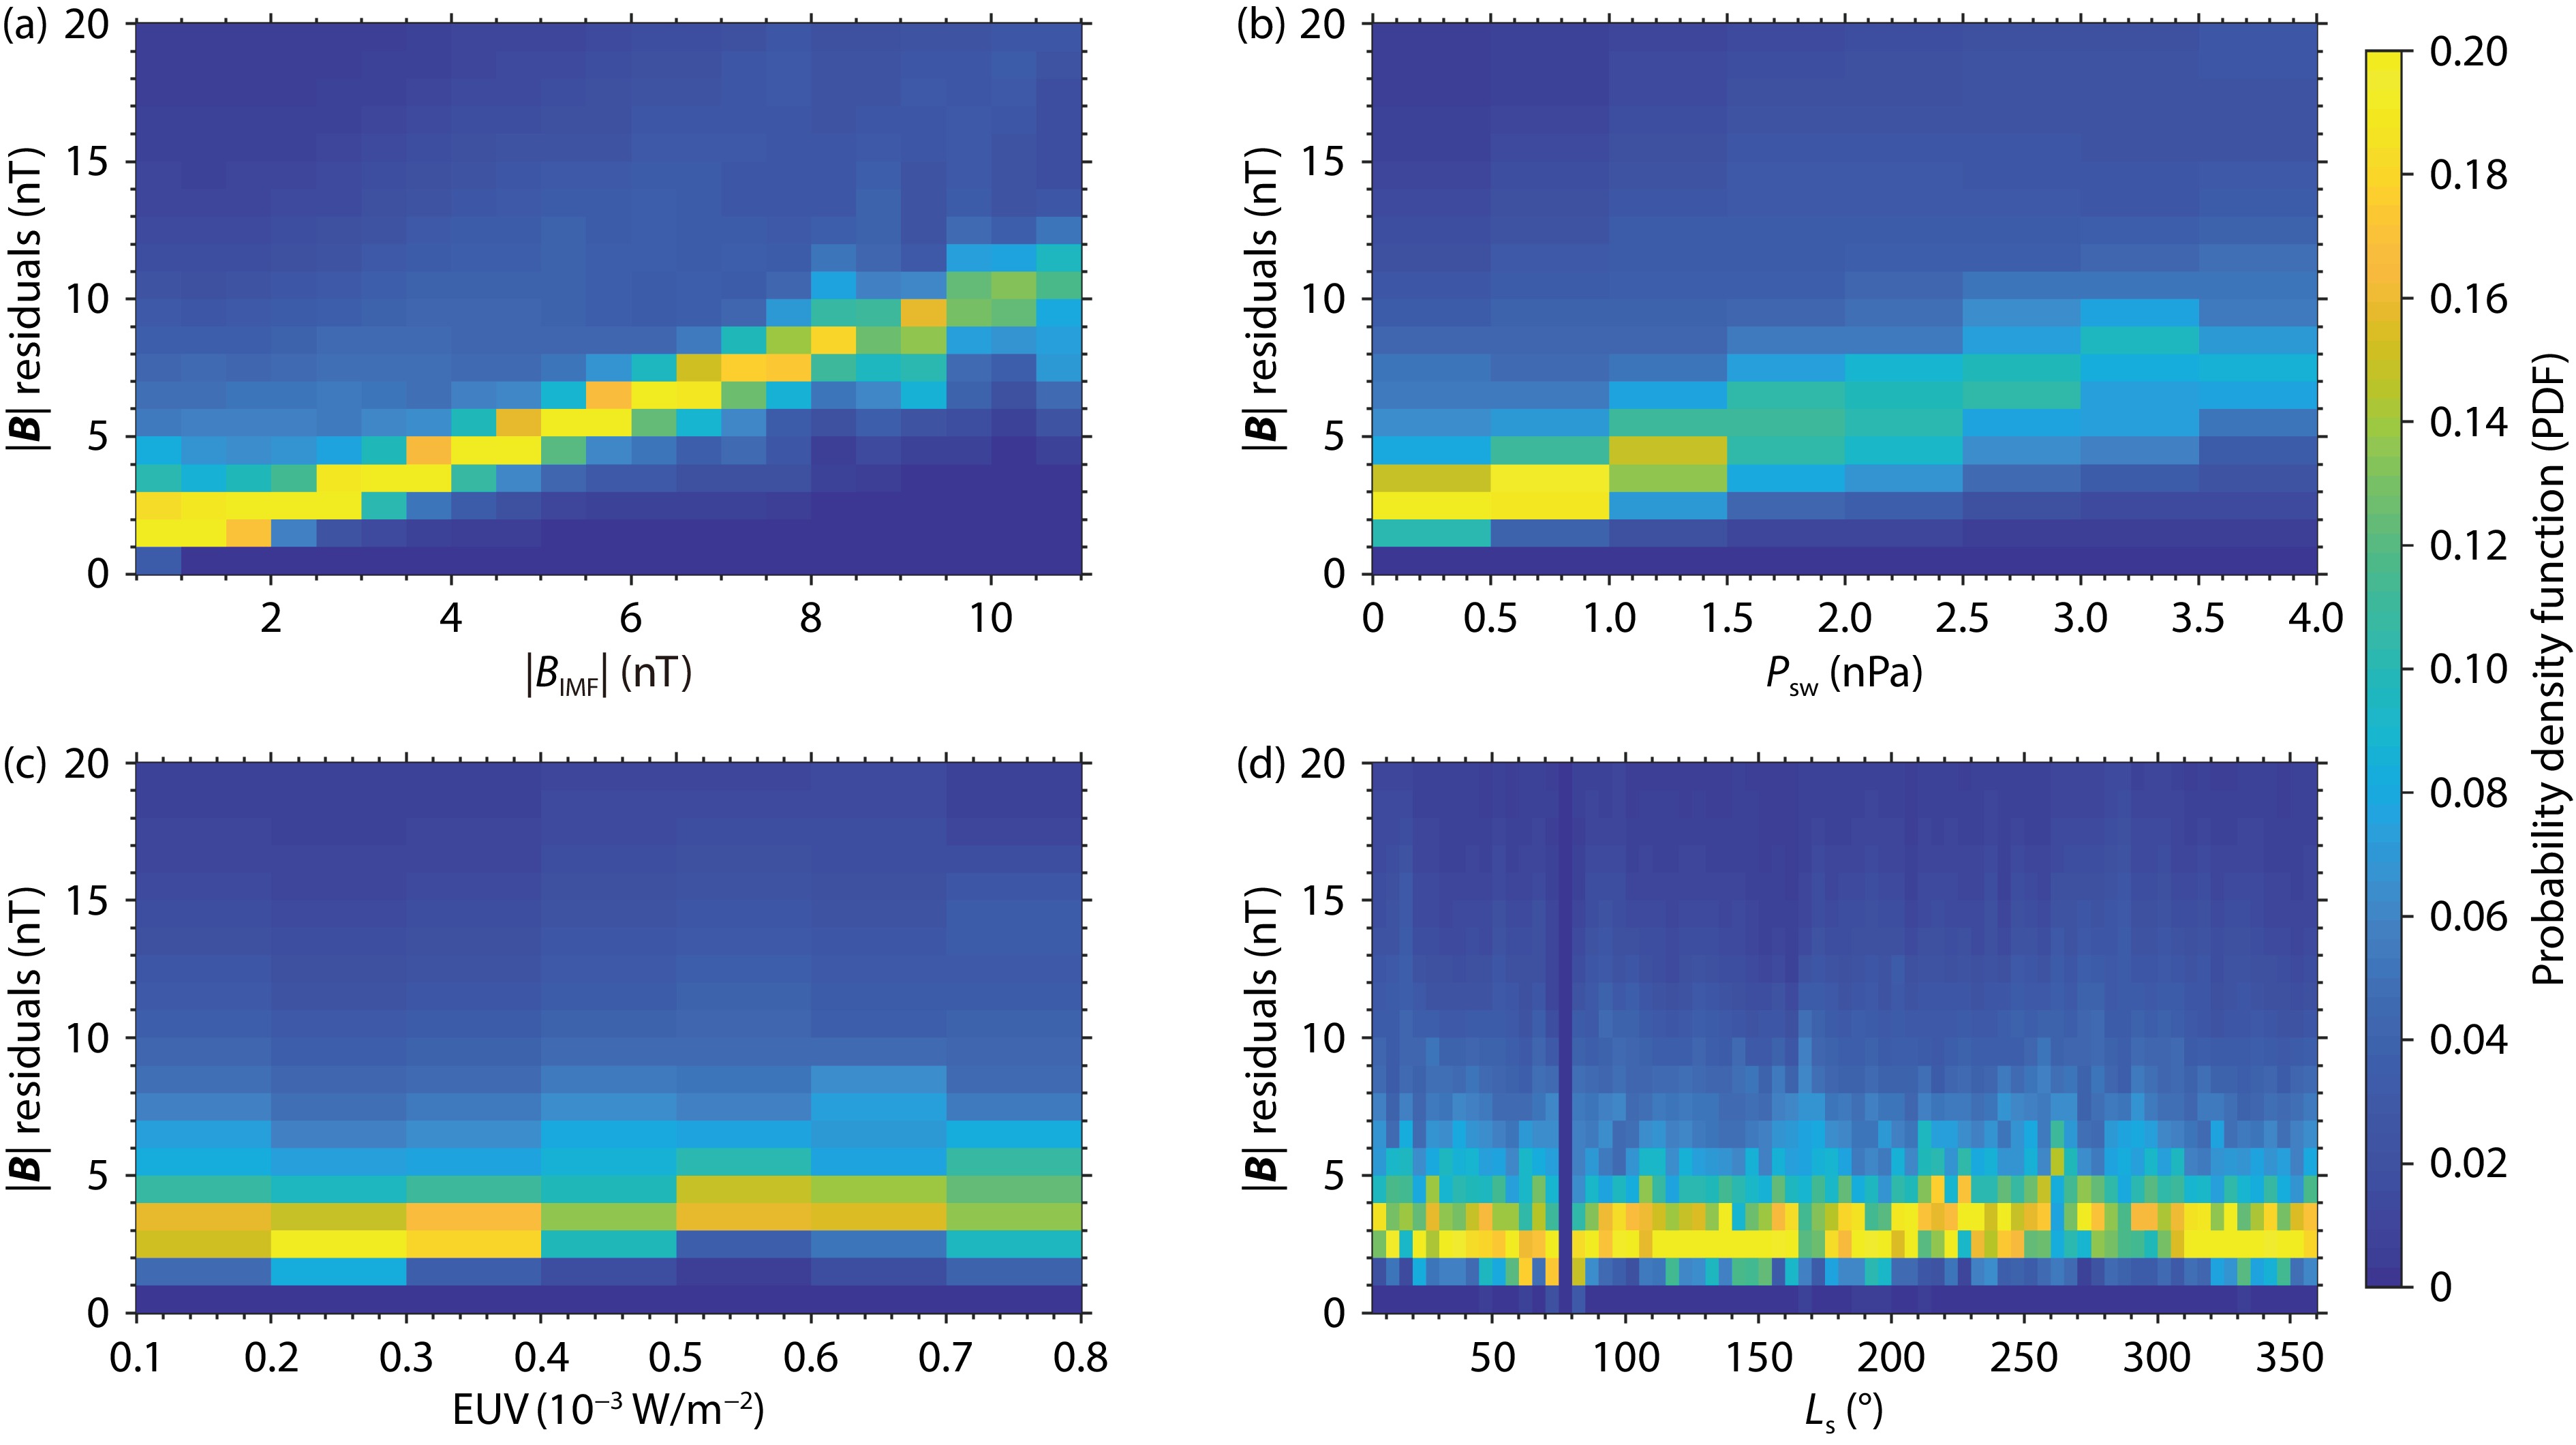
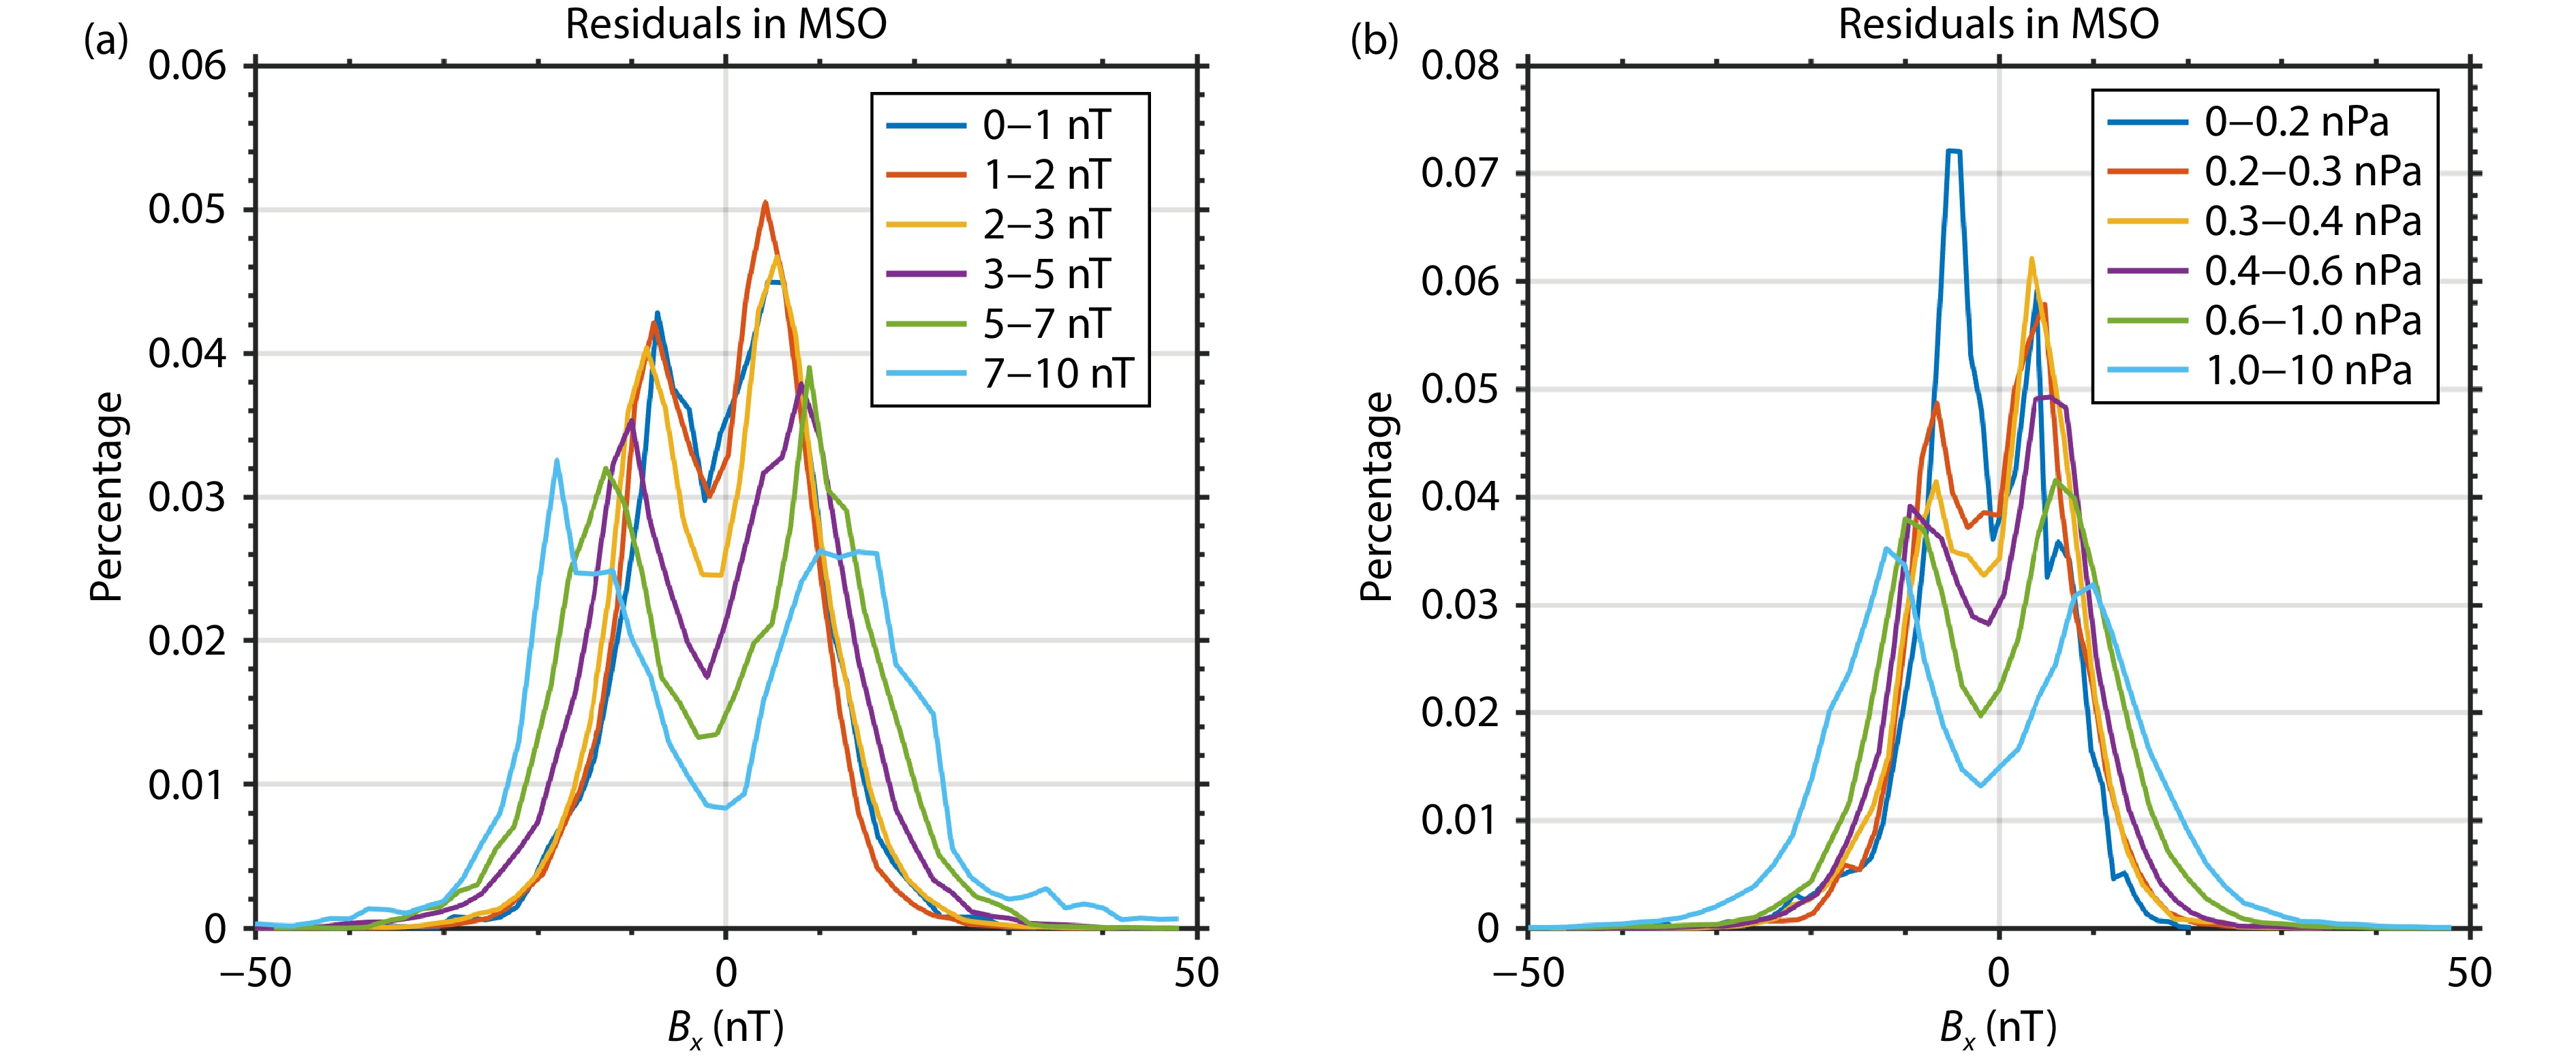
Figure 3 illustrates conditional probability density functions of magnetic field residuals in the nightside ionosphere, as influenced by the upstream drivers. Previous research has identified positive correlation between the
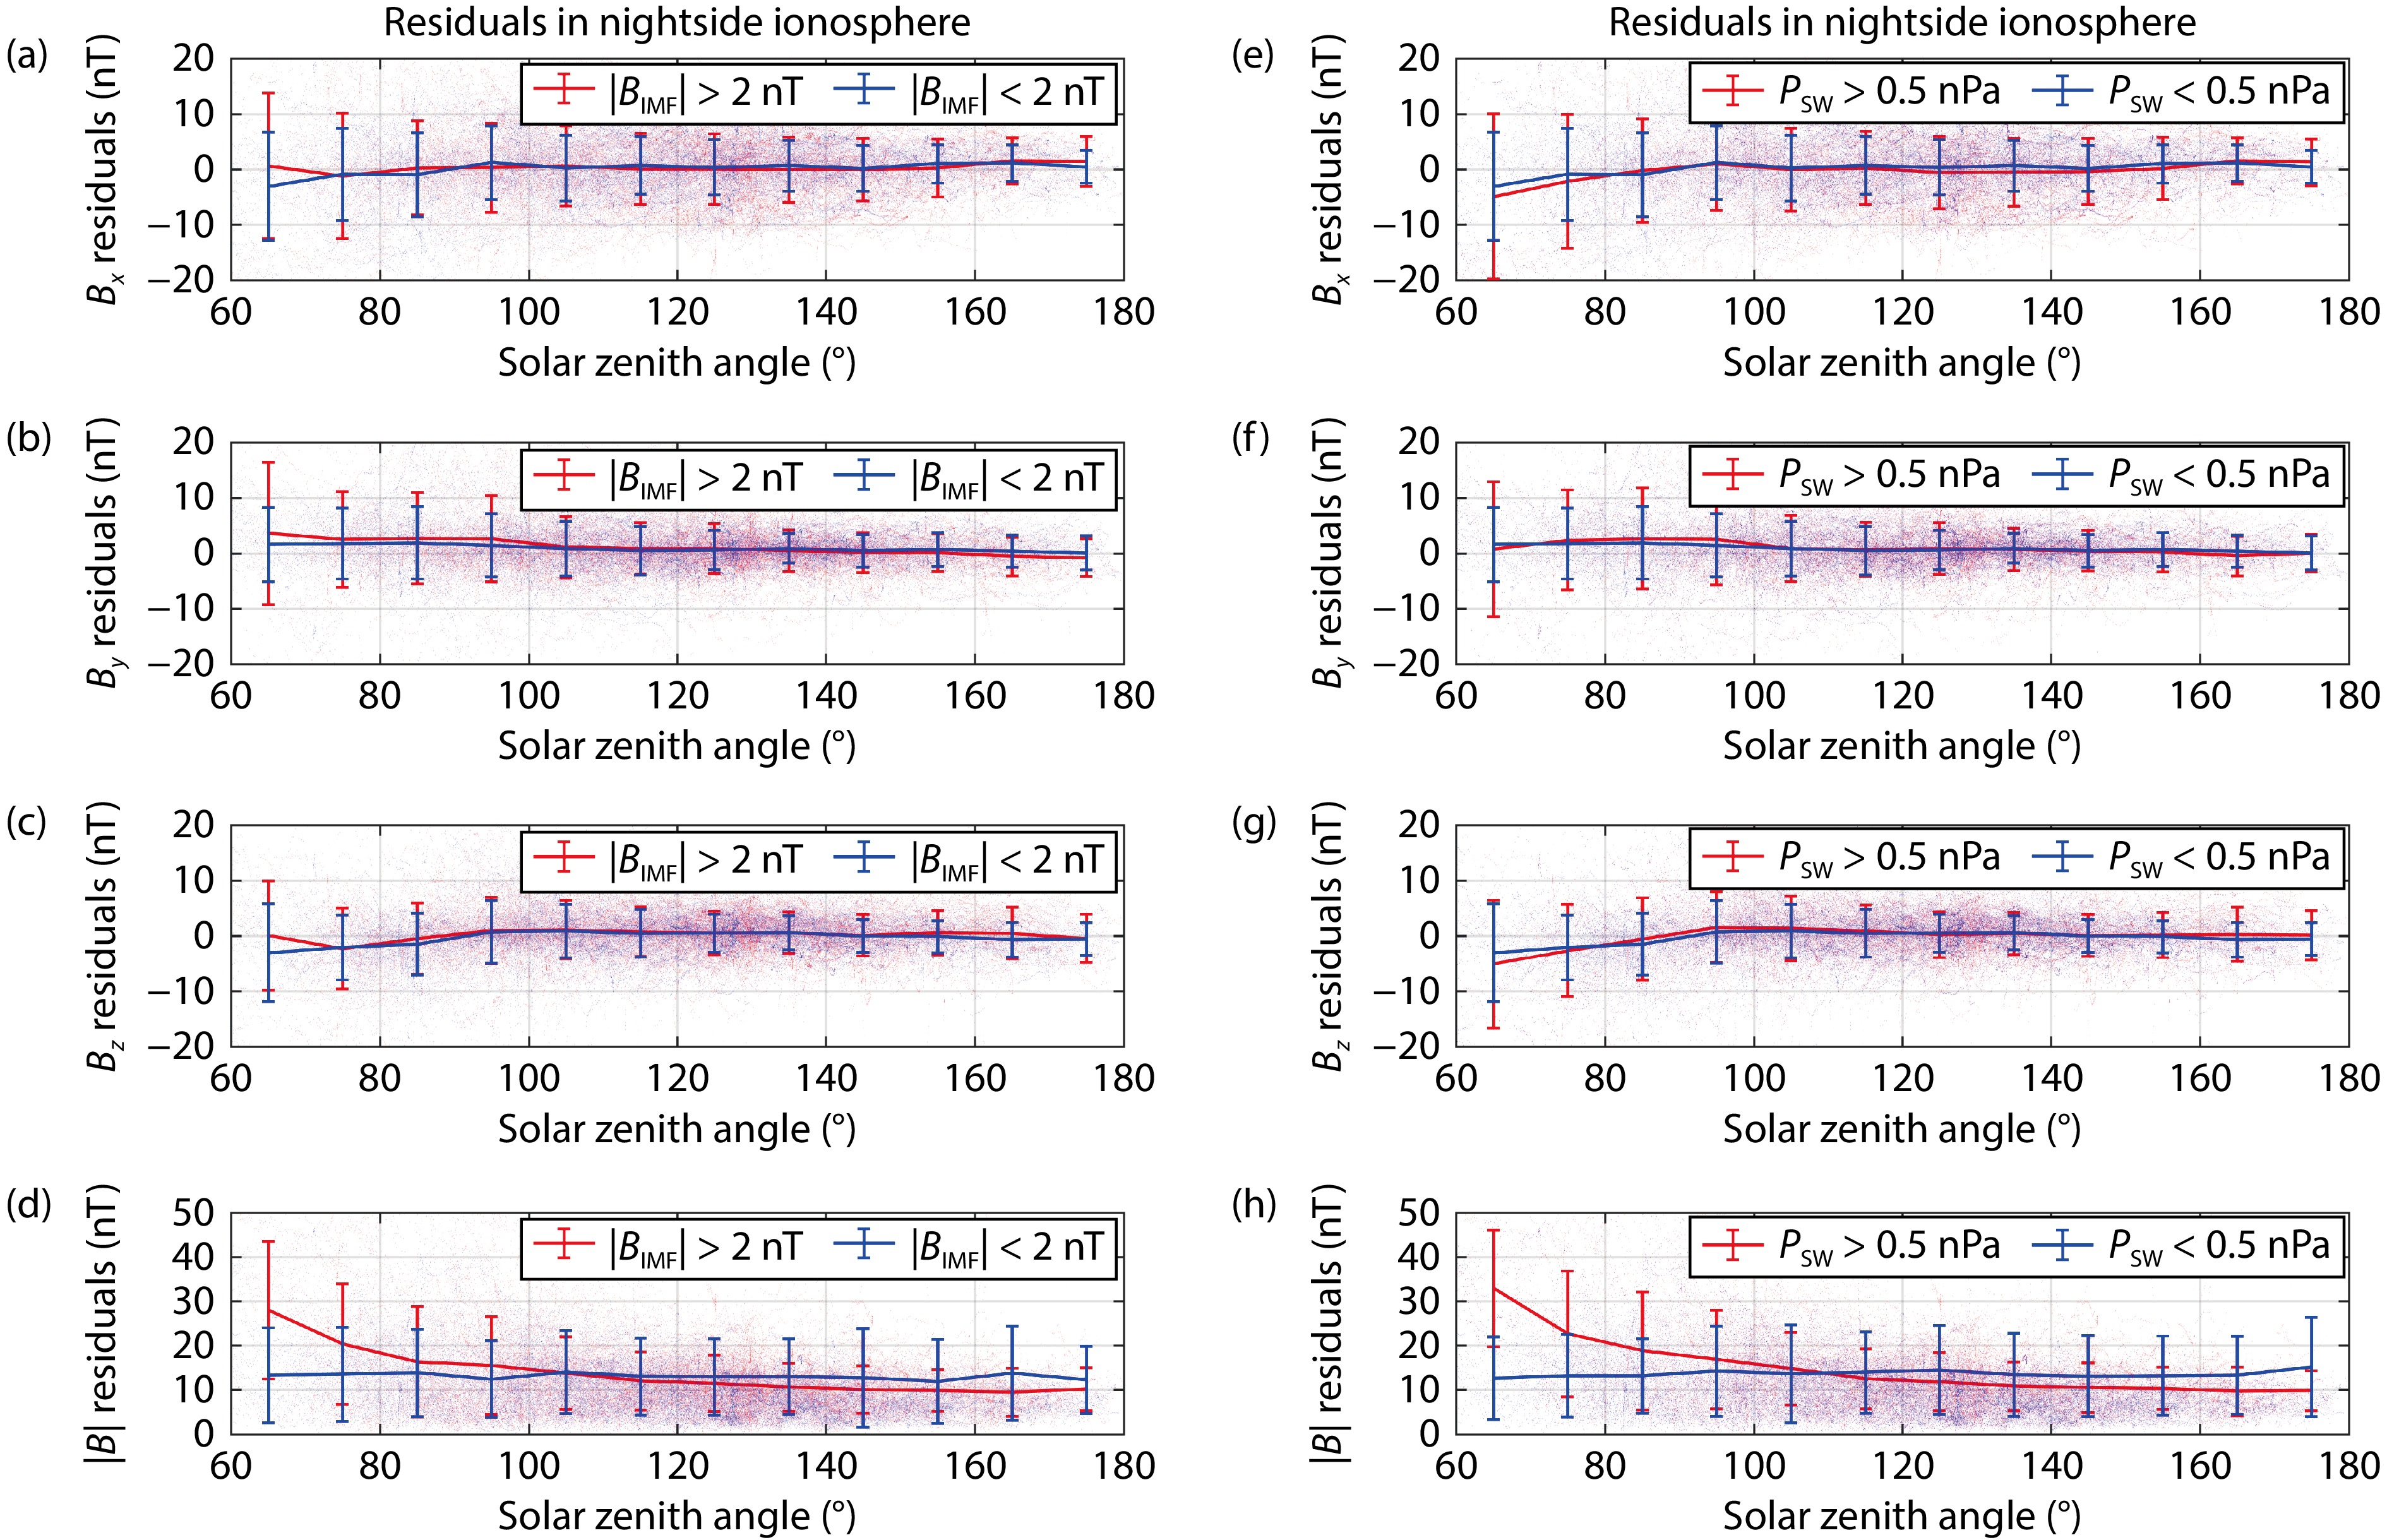
Figure 5 illustrates the variation of ionospheric magnetic field residuals, measured below 600 km altitude, with the solar zenith angle (SZA) under conditions of low and high
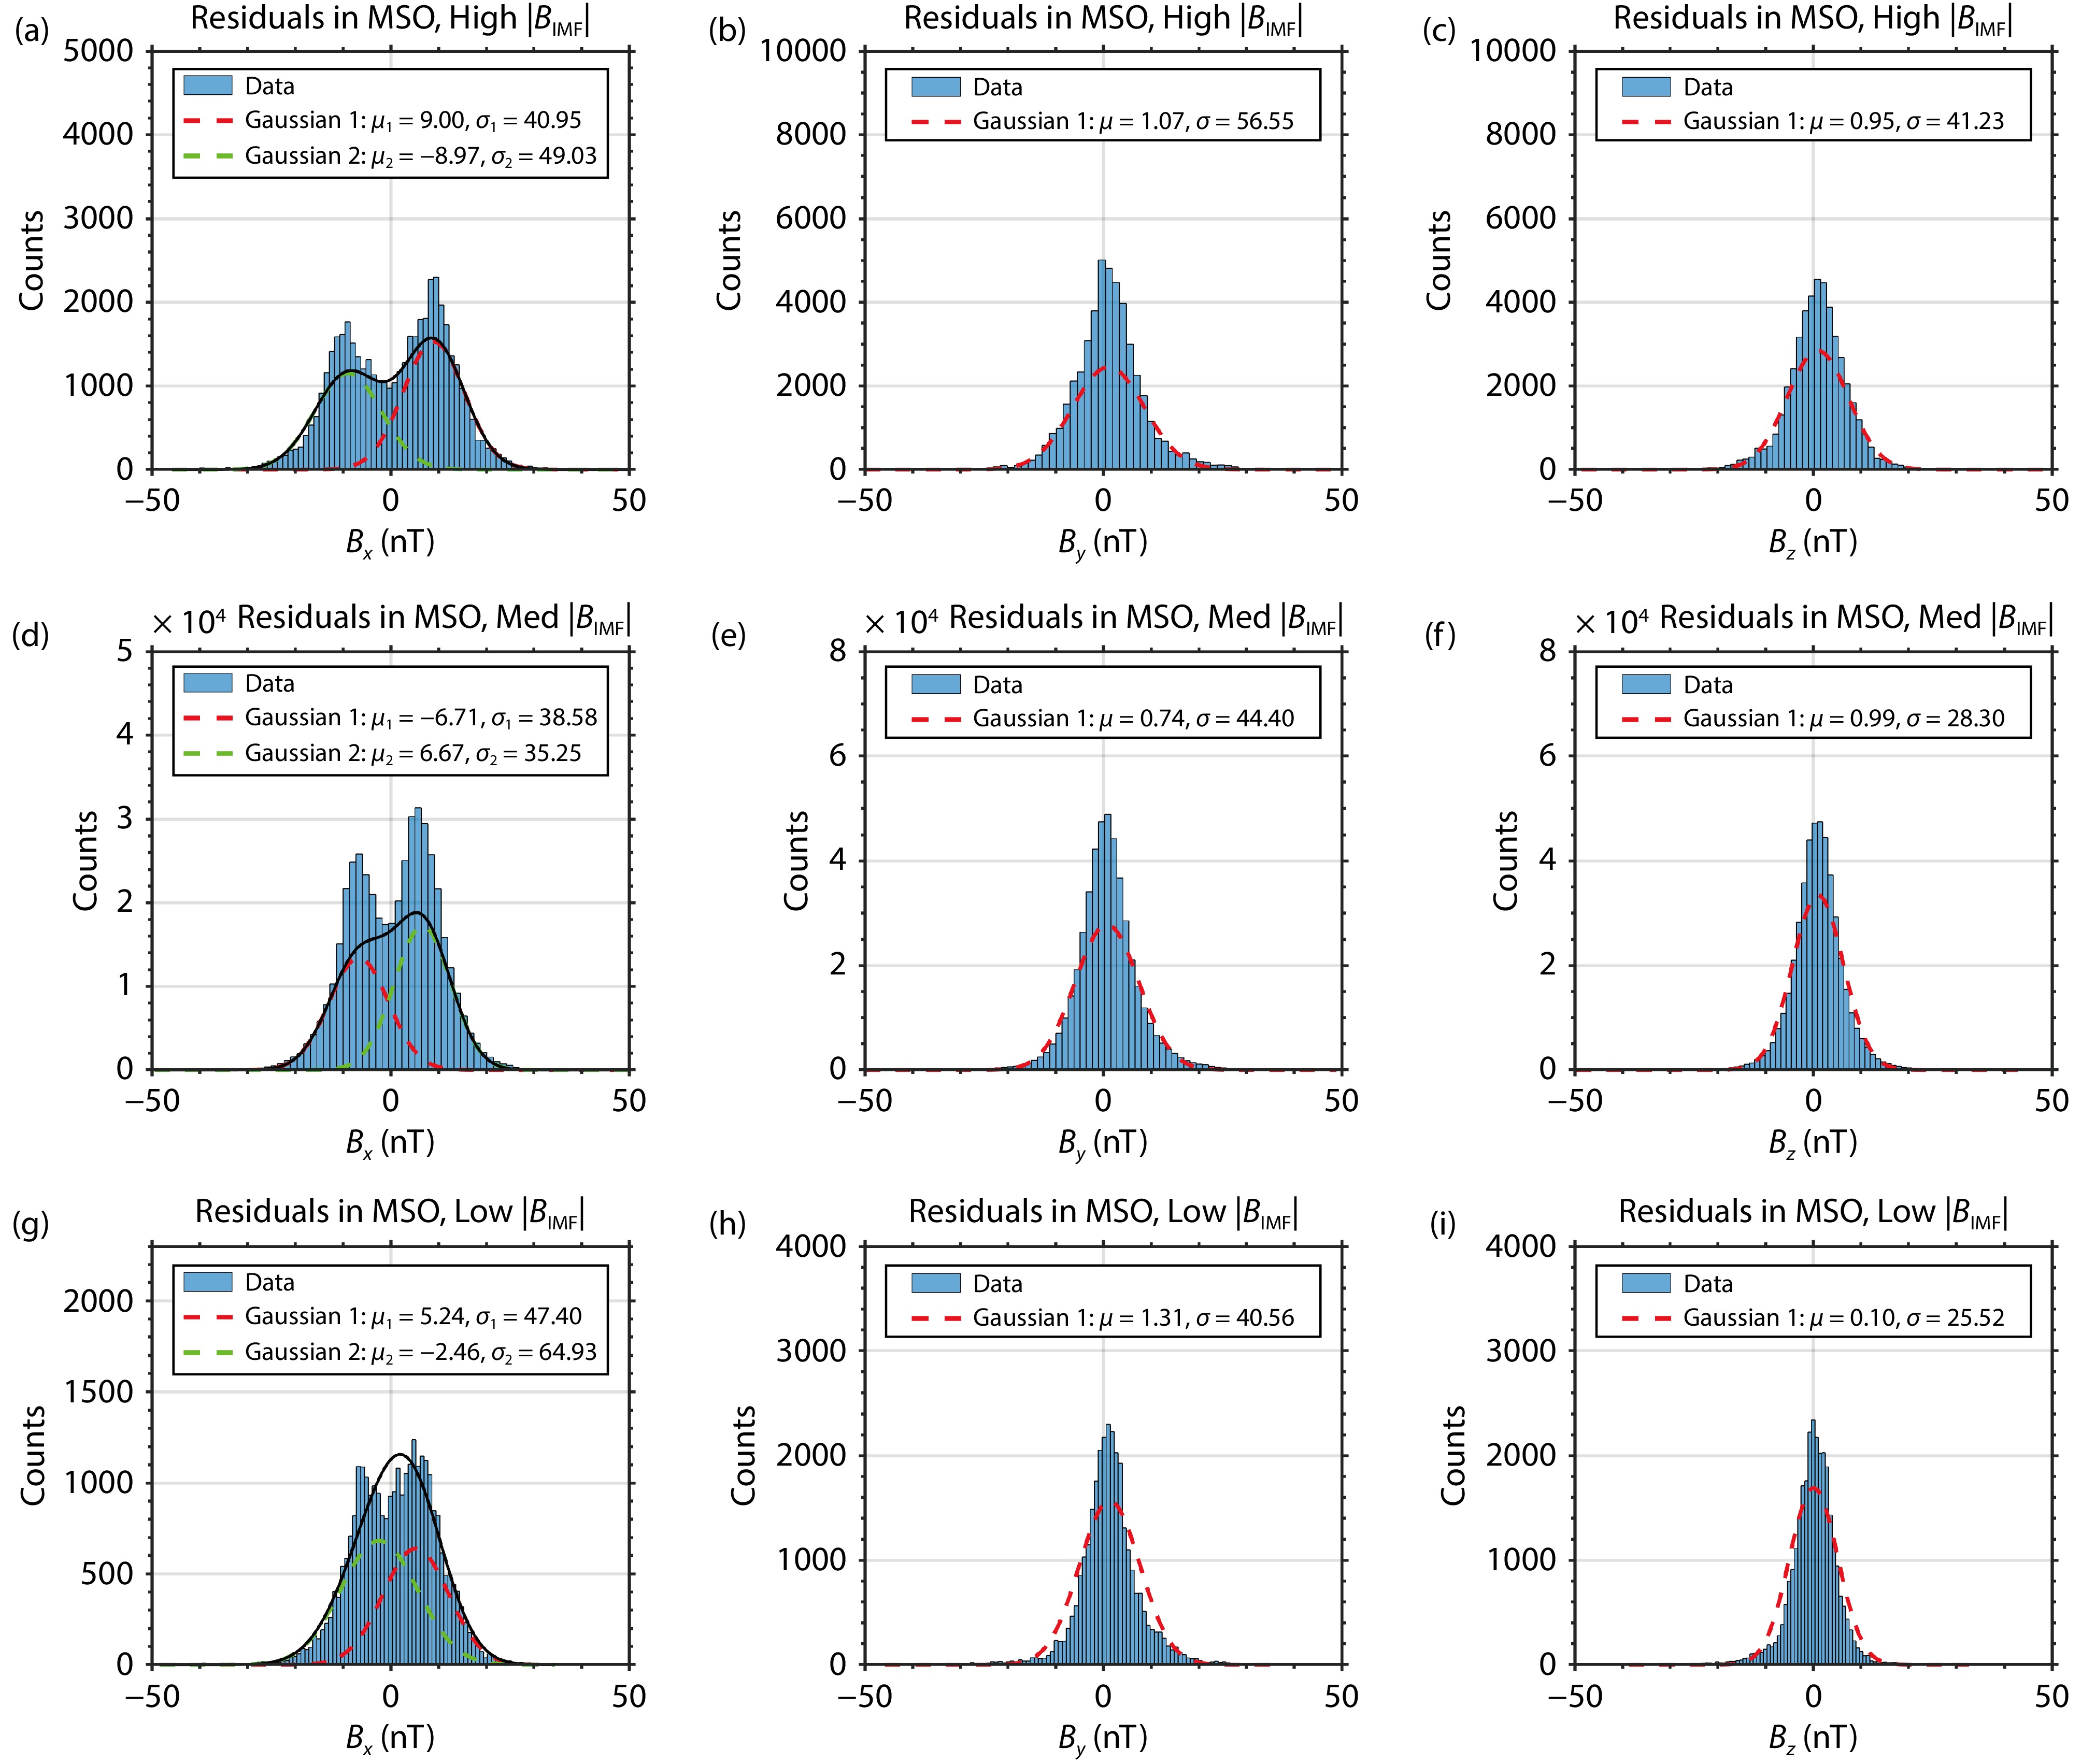
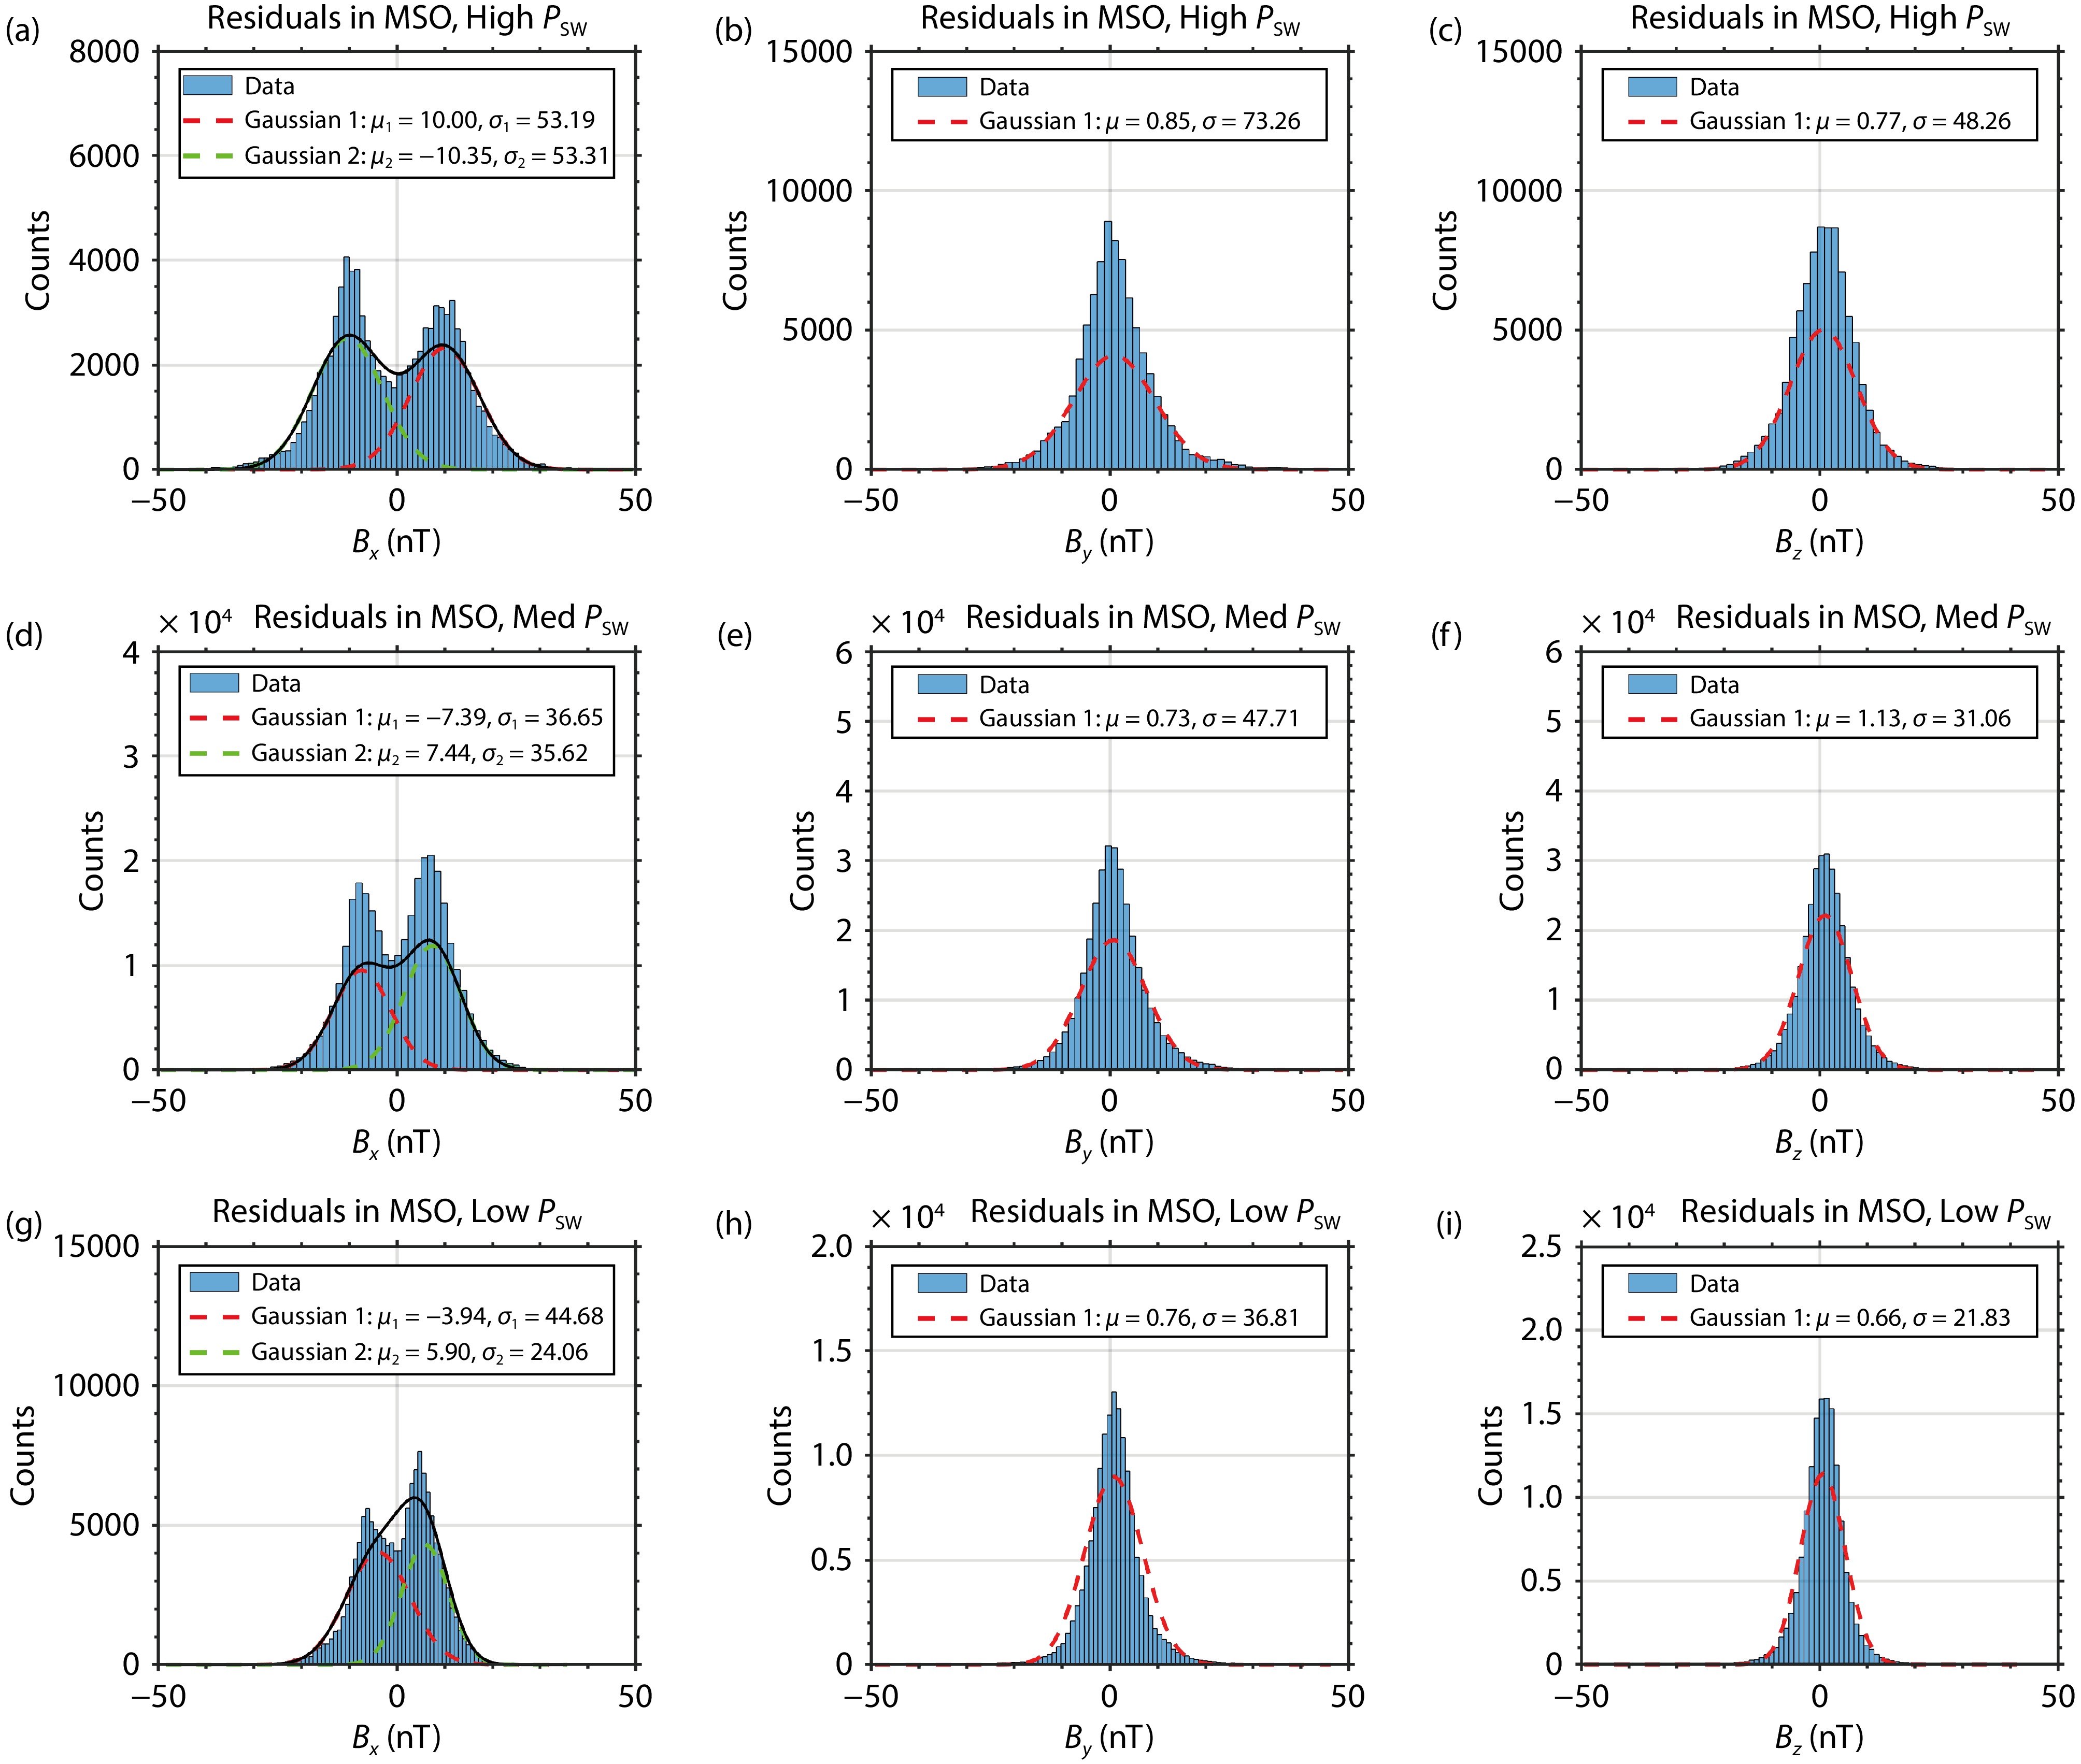
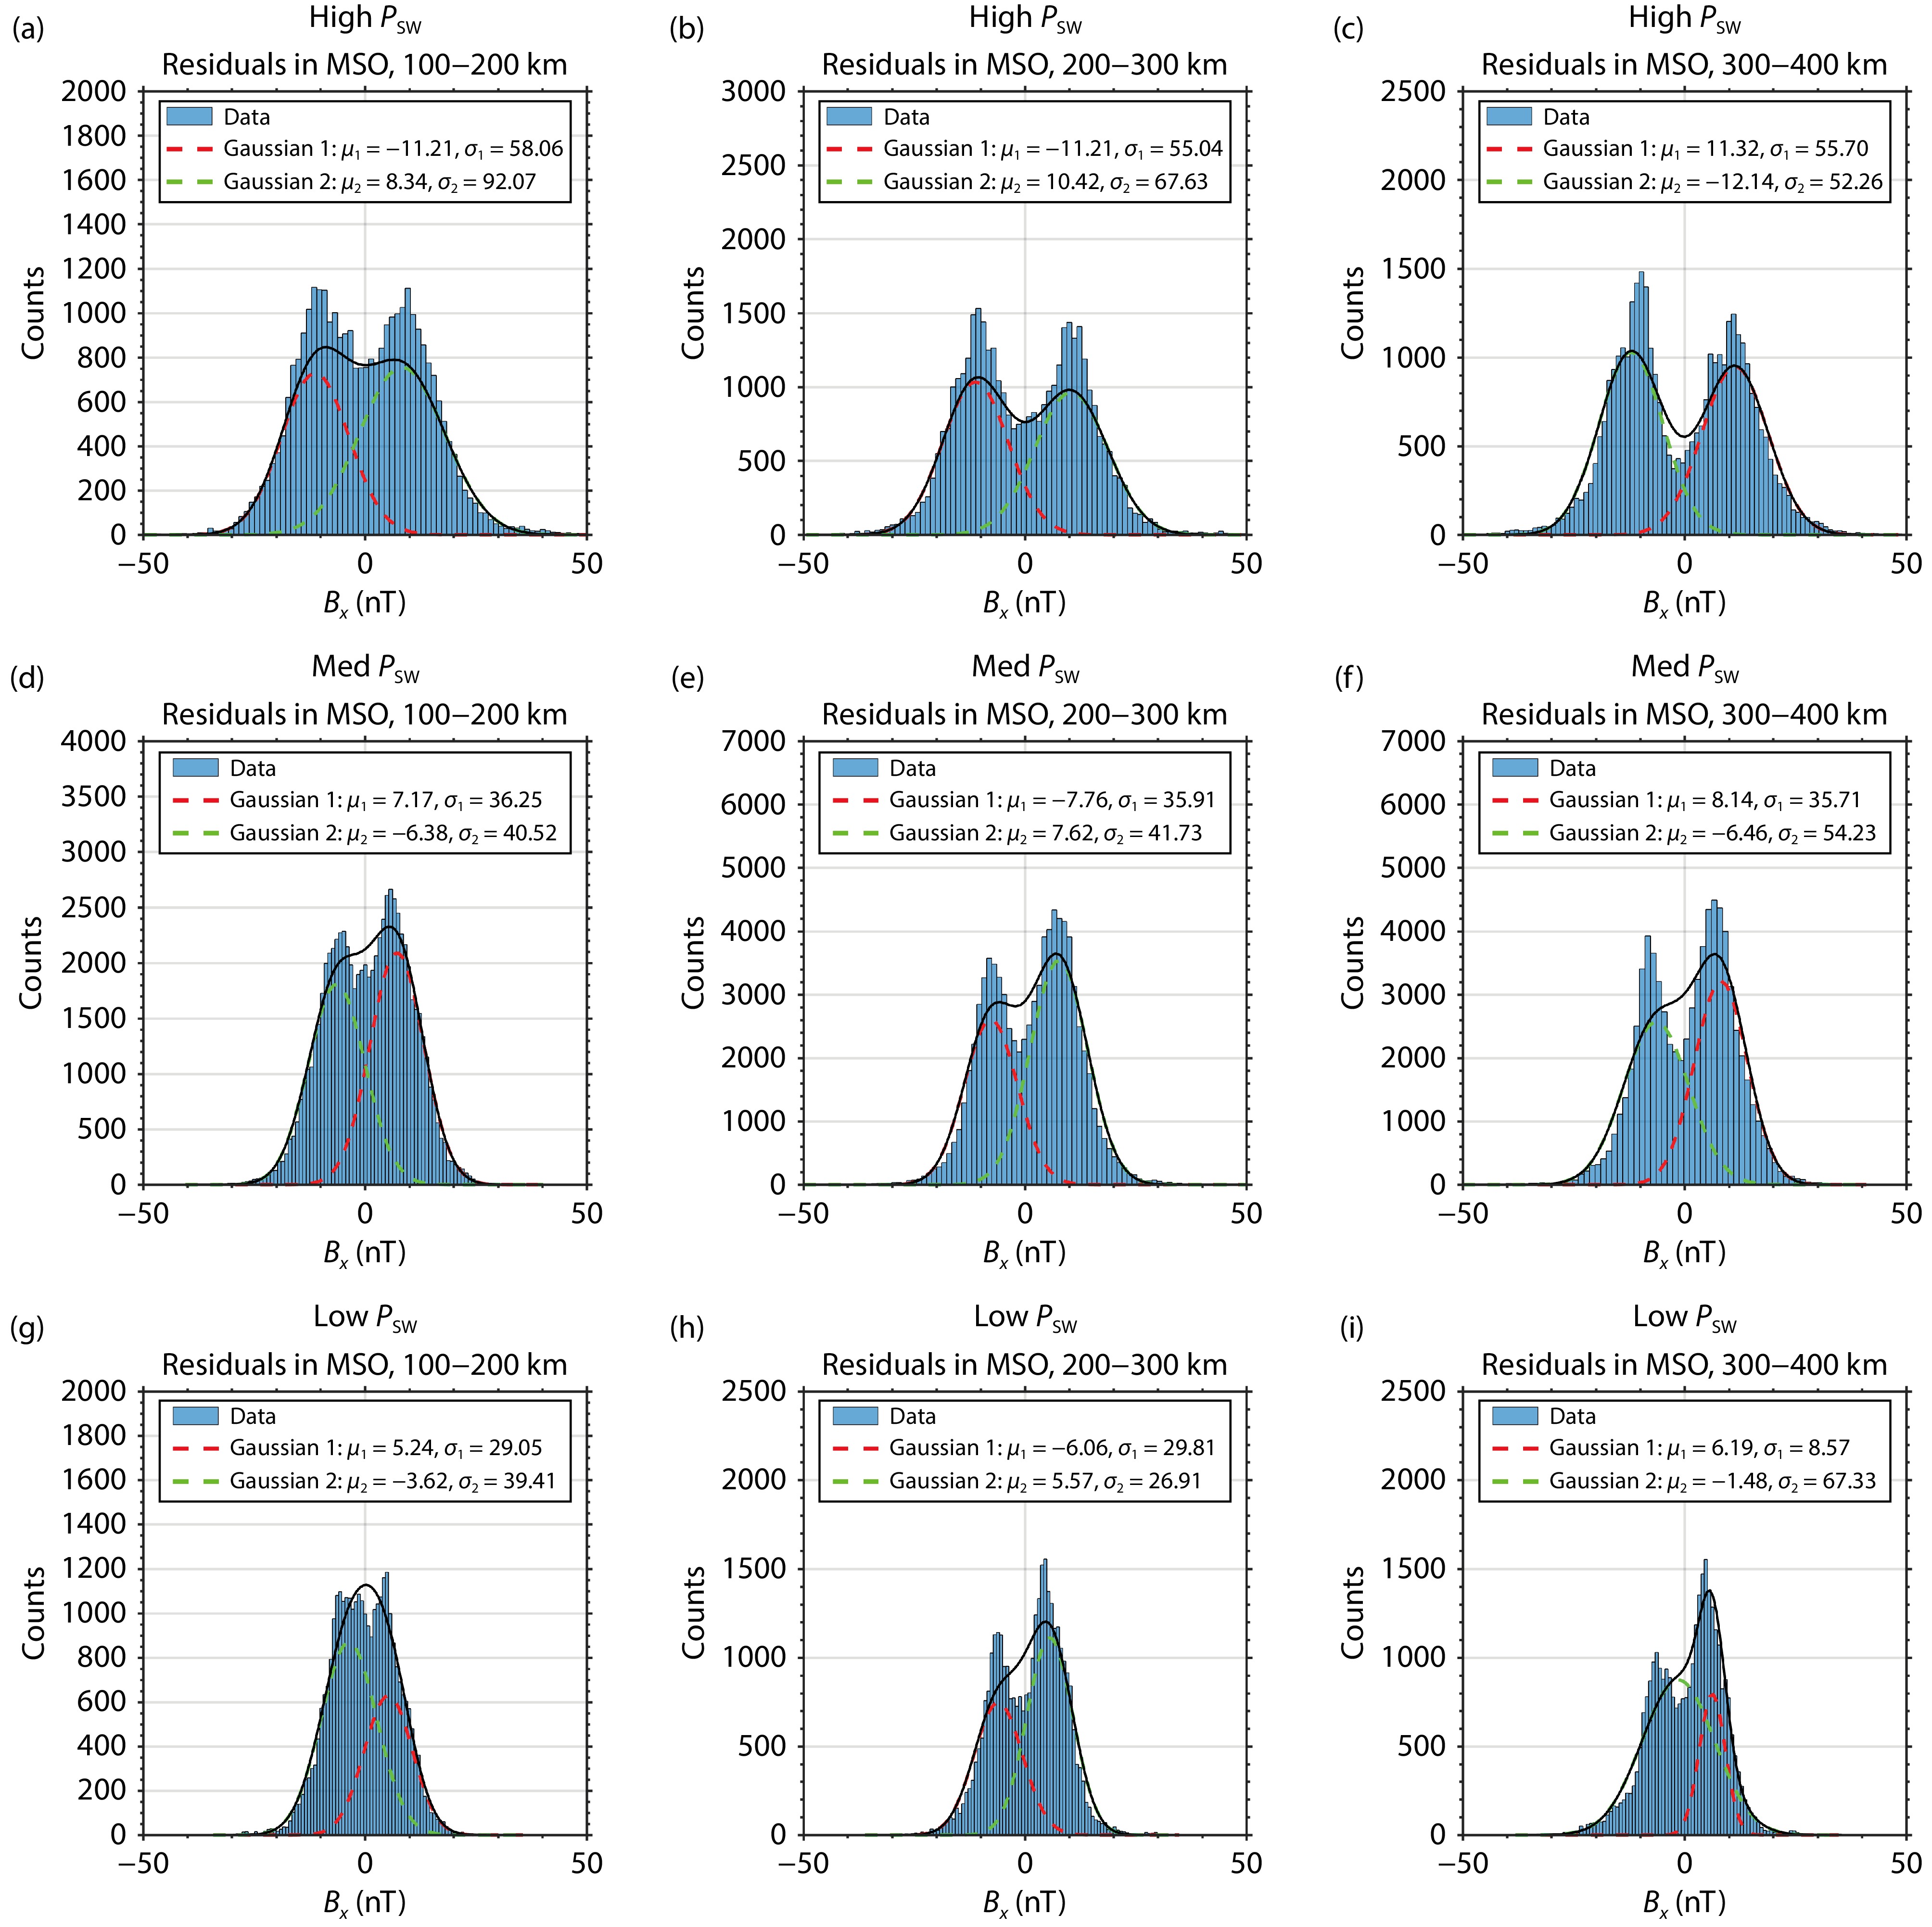
Figure 6 and Figure 7 show histograms of nightside magnetic field residuals —
For reasons stated above, we chose a bi-modal normal distribution to fit the probability density function of the
Figure 8 shows the variance in the distribution of the
Previous studies have shown that the IMF can extend as far inward as the MGS mapping altitudes, reaching up to 400 km (Brain et al., 2020). The bi-modal distribution of the
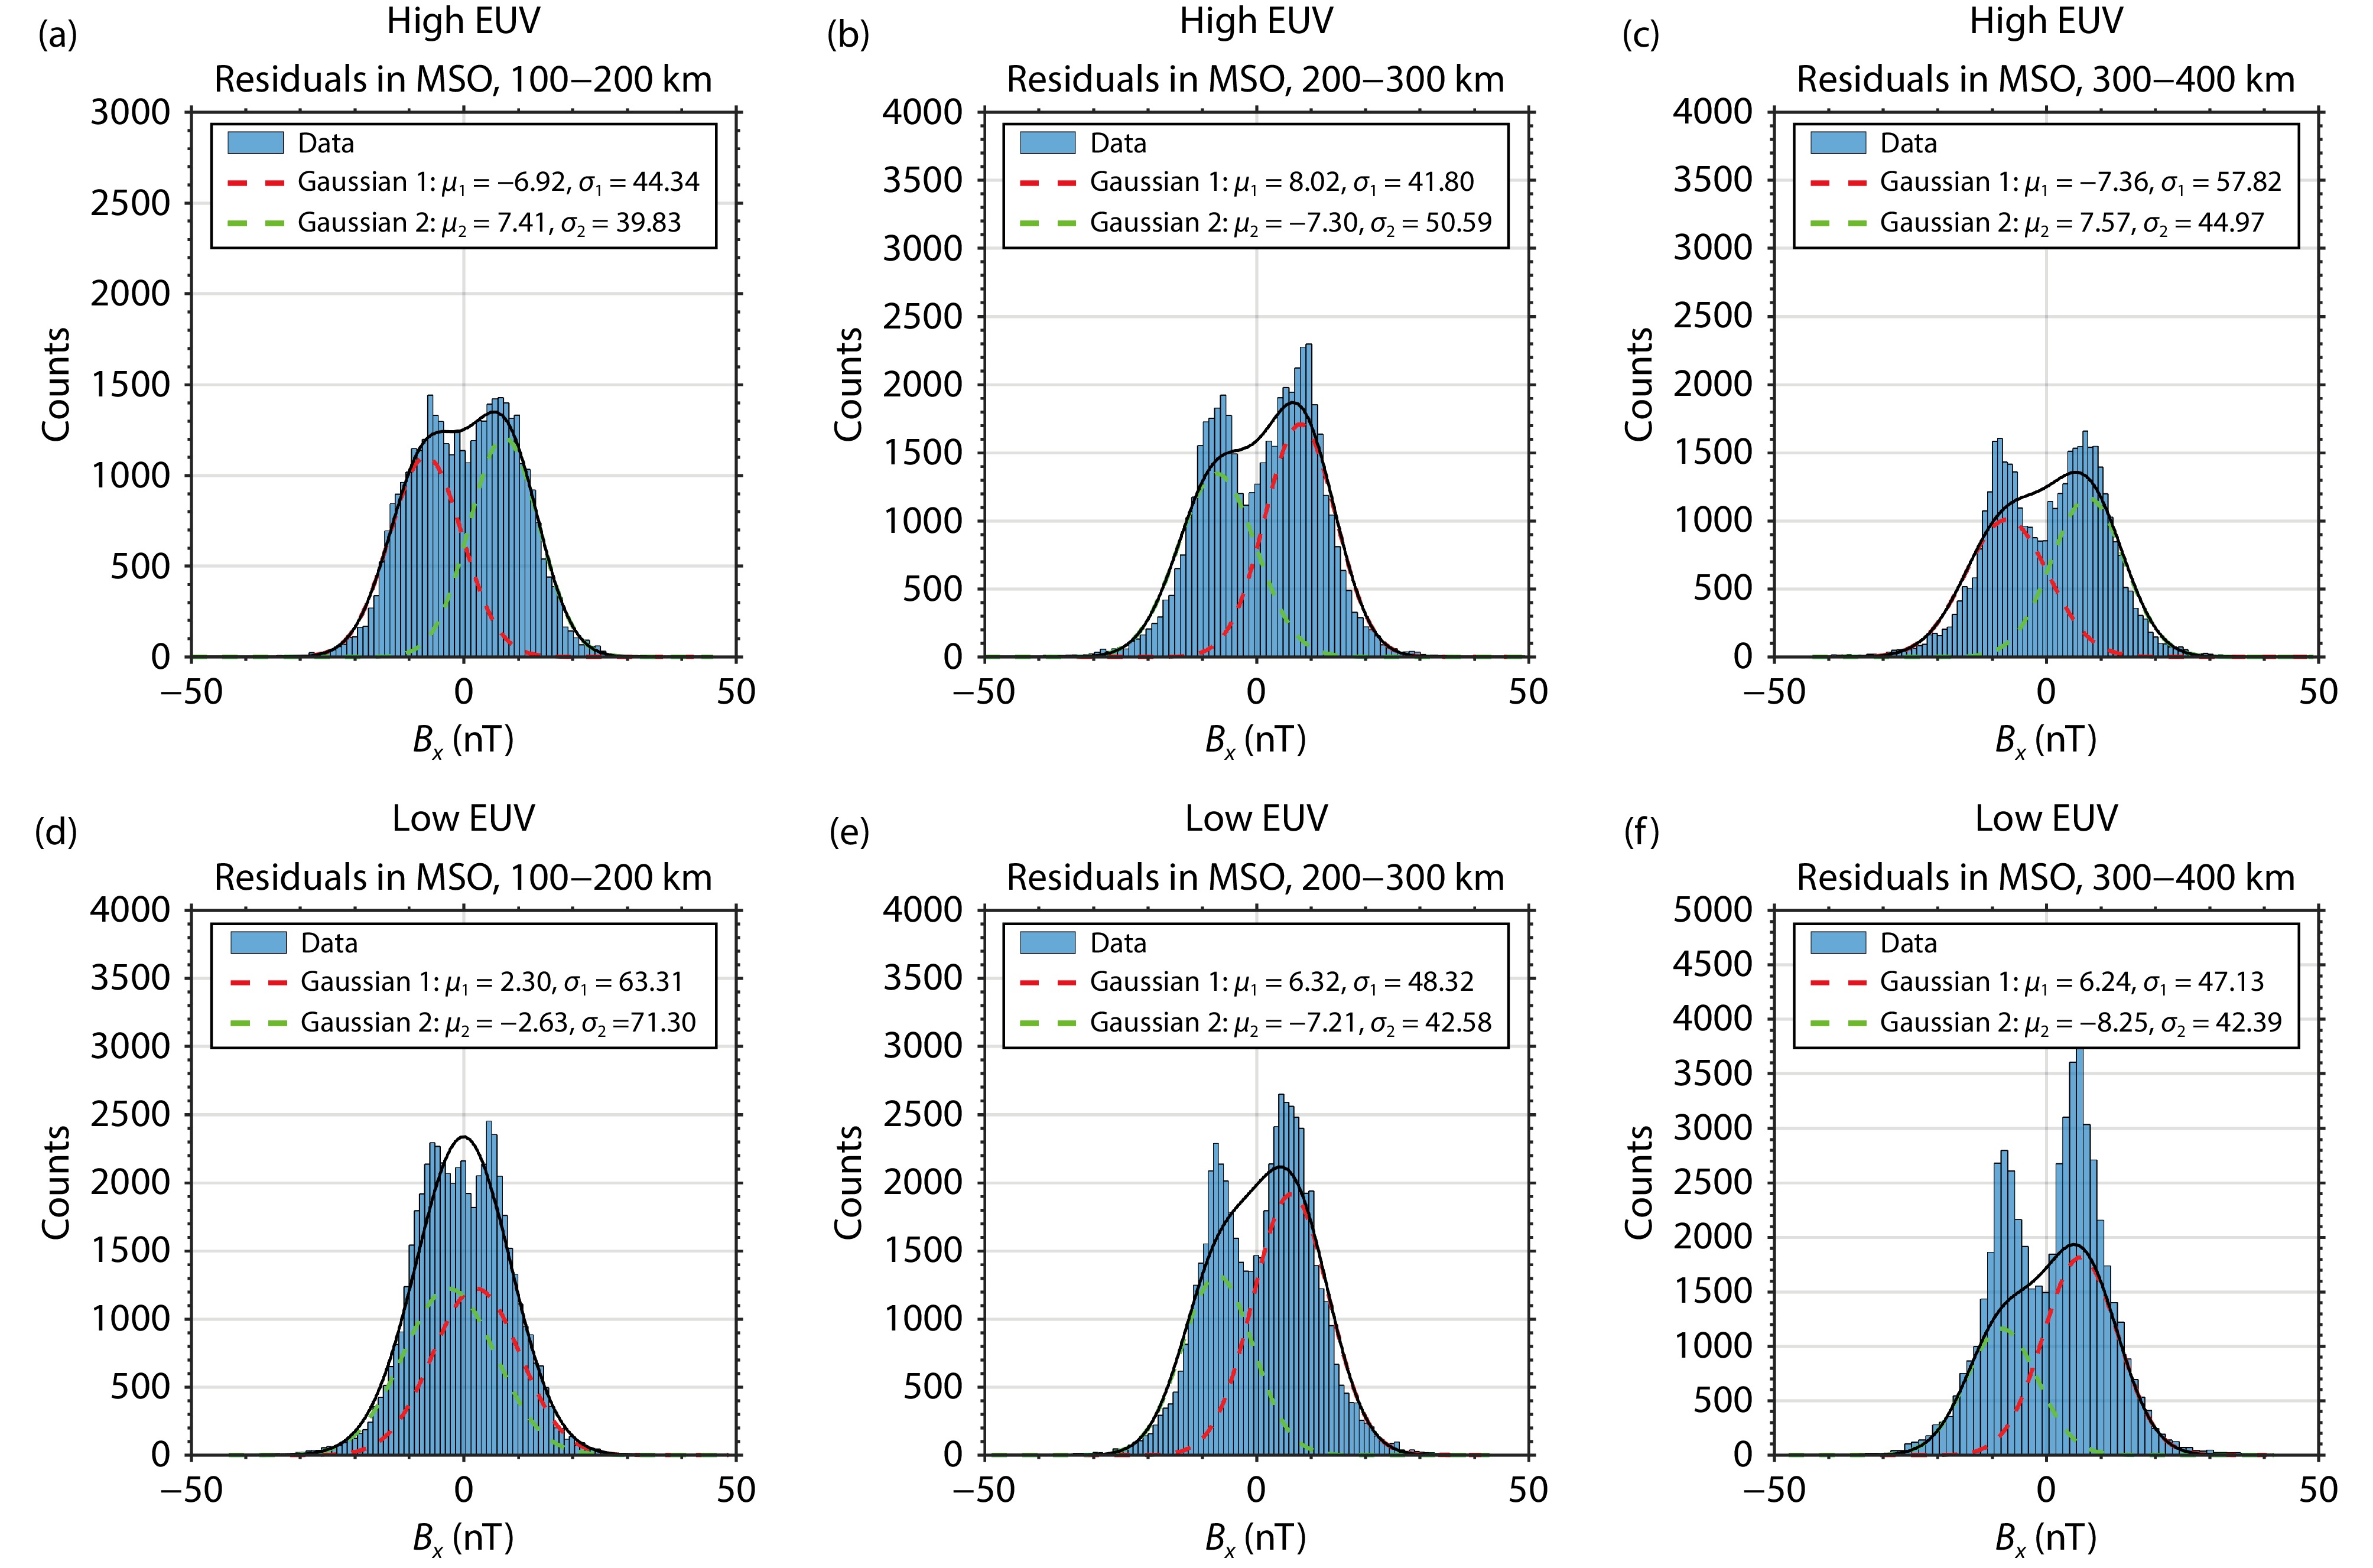
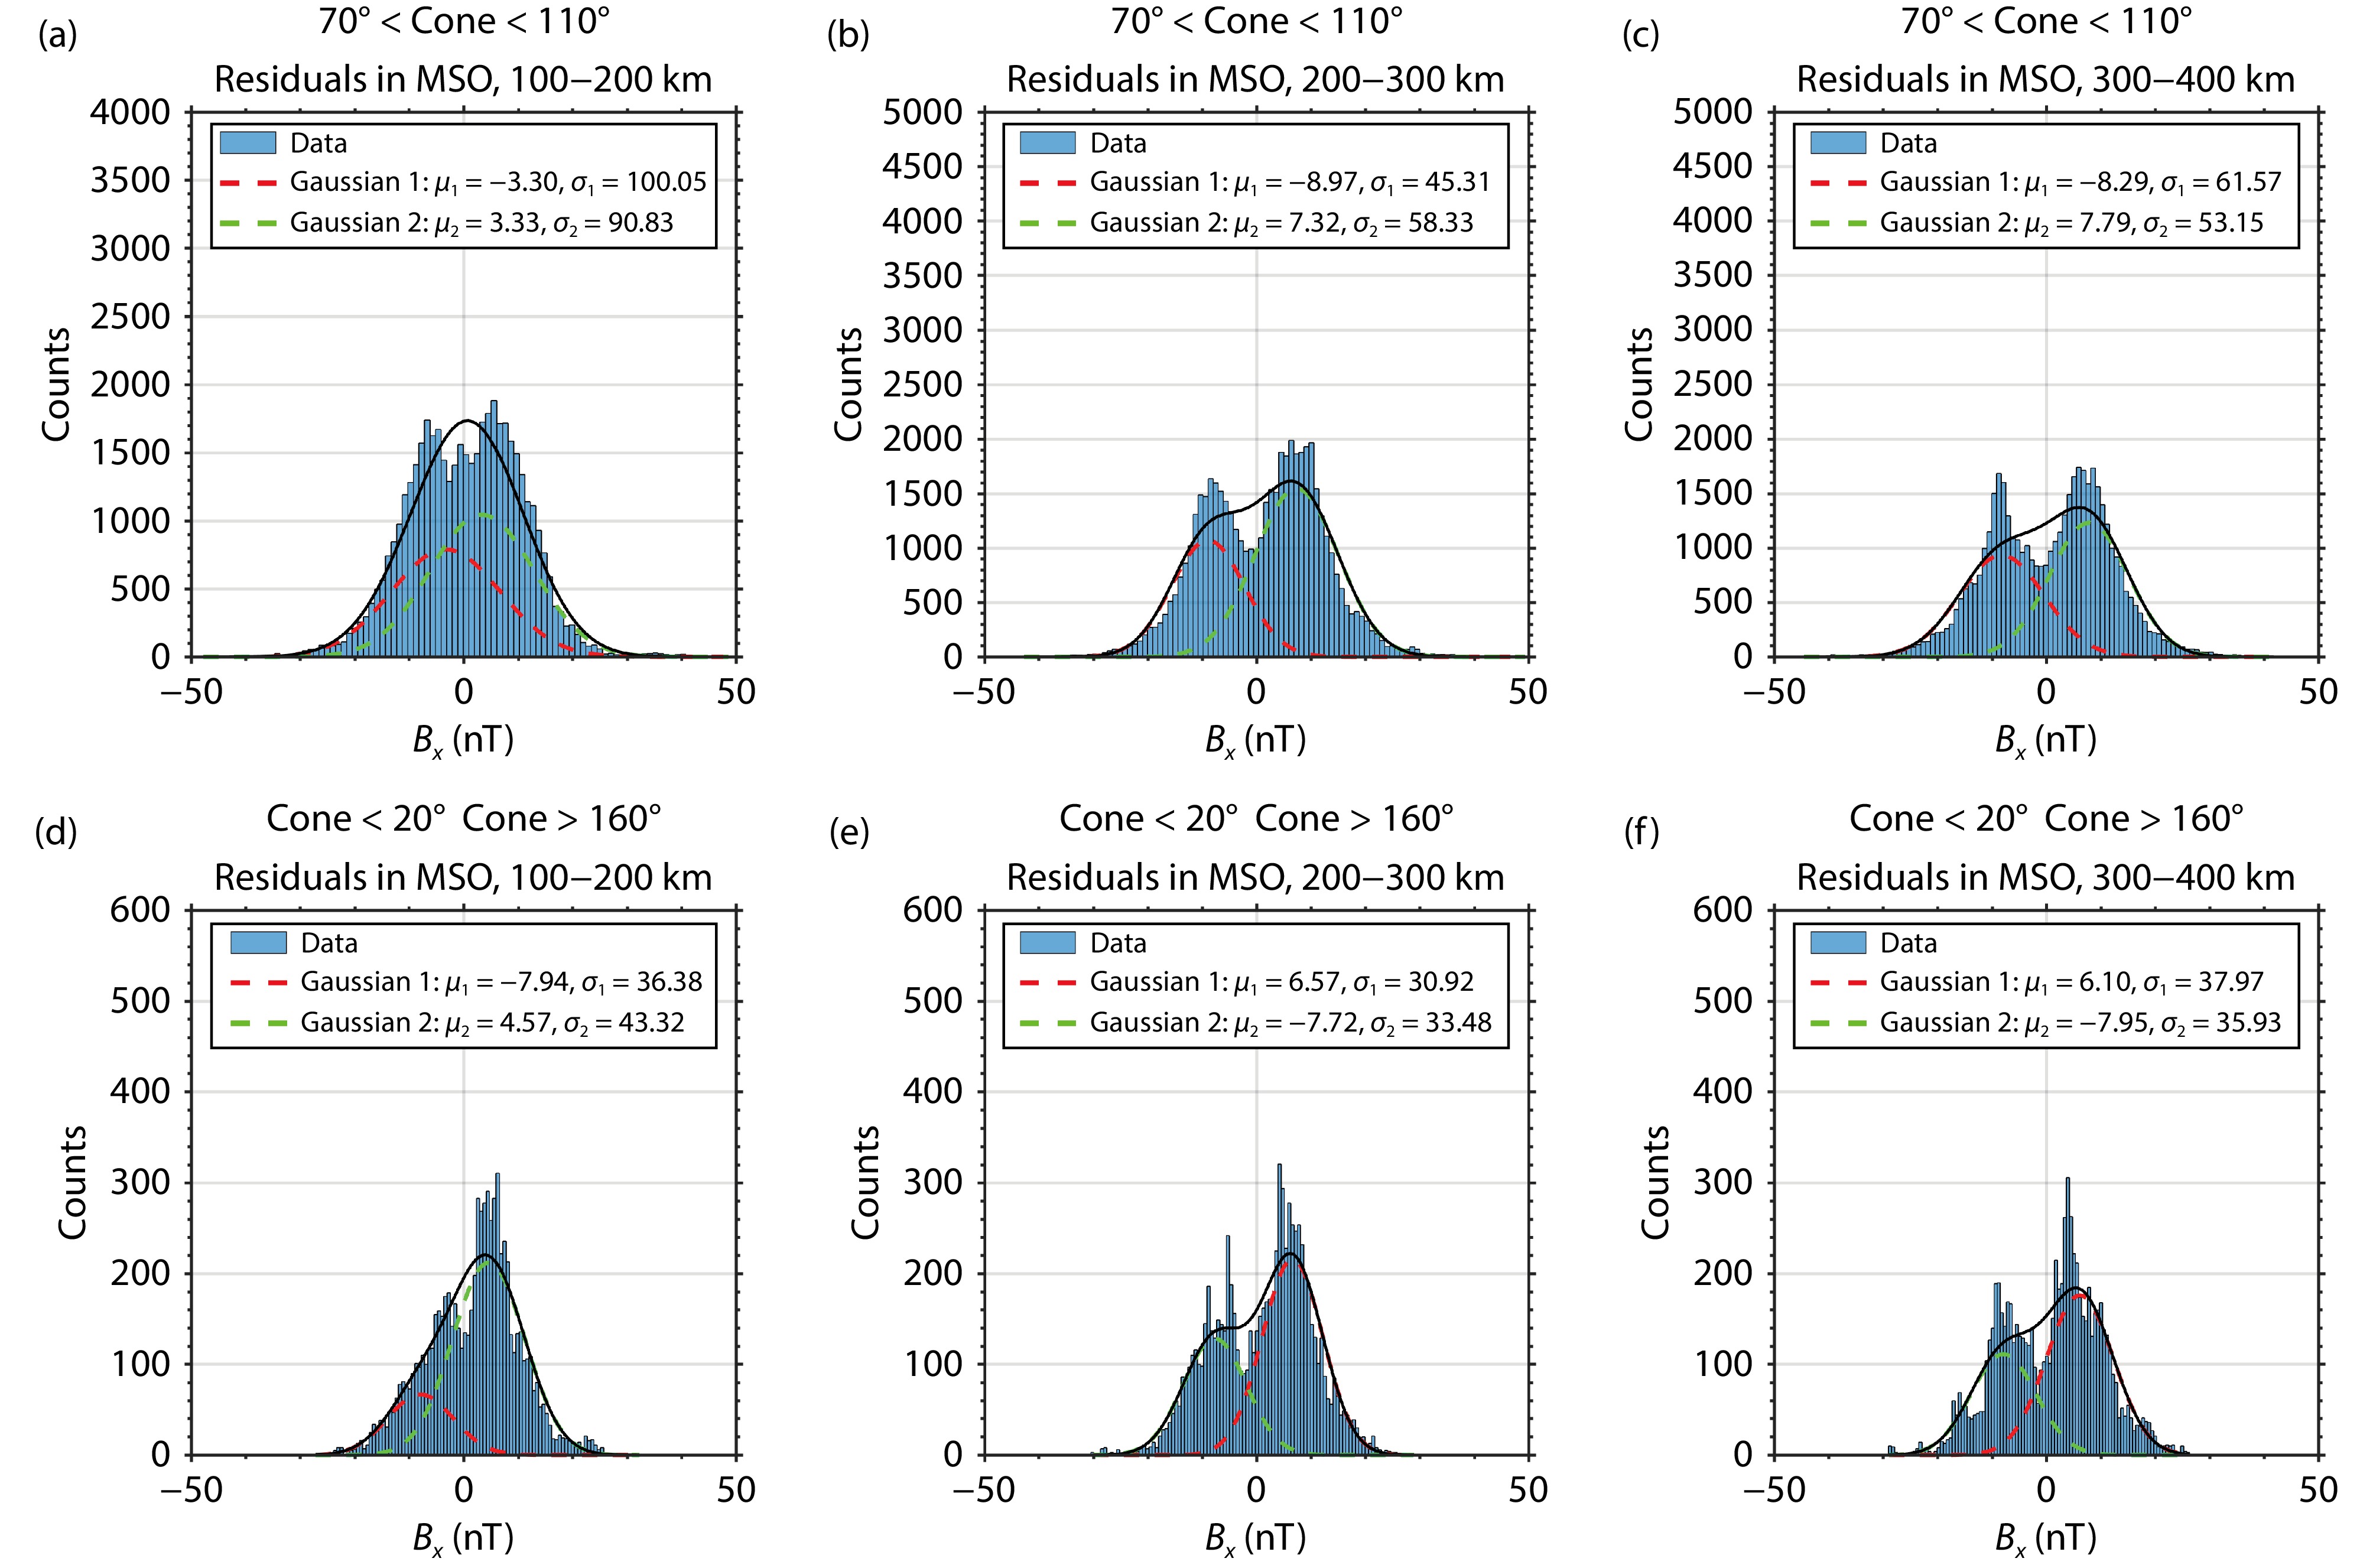
The IMF penetrating altitude may also depend on the solar EUV radiation and the IMF cone angle. Brain et al. (2020) suggested that during periods of high EUV, an increase in photoionization leads to heightened ionospheric thermal pressure on the dayside and near the terminator, thereby inhibiting the penetration of a draped IMF into the ionosphere. Moreover, the influence of the IMF direction, particularly the cone angle, on the topology of the magnetic field in the Martian magnetosphere has been well recognized (e.g., Burne et al., 2021; Zhang C et al., 2022; Zhang Q et al., 2023). However, the effect of the IMF cone angle on the penetrating altitude of the IMF has not been thoroughly explored. Figure 11 and Figure 12 illustrate histograms of nightside magnetic field residuals across three altitude ranges under varying EUV flux and IMF cone angle conditions. In this study, we define the IMF cone angle as the angle between the projected IMF and
Figure 11 demonstrates that under both high and low EUV conditions, the IMF can penetrate to an altitude of 200−300 km. Below 200 km altitude, the separation between the two peaks in the
Using MAVEN data from November 2014 to May 2023, we have investigated the distribution of magnetic field residuals in the Martian nightside ionosphere under four upstream solar wind drivers: the intensity of the IMF (
(1) The magnetic field residuals in the Martian ionosphere show significant positive correlation with
(2) Under varying upstream conditions, including both high and low
(3) The distribution of upstream EUV and IMF cone angles does not significantly affect the altitude to which the IMF penetrates. However, we observe that the separation of the bi-modal normal distribution of the
In the Martian ionosphere, the external magnetic field originates from two primary sources. The first is the interaction between the solar wind and the ionosphere, resulting in the draping and stacking of the IMF at ionospheric altitudes (e.g., Ferguson et al., 2005; Fang XH et al., 2023). The second source is the ionospheric magnetic field generated by ionospheric currents powered by the ionospheric dynamo (e.g., Mittelholz et al., 2017; Lillis et al., 2019). These two sources of the external magnetic field can be distinguished in Figure 5. The ionospheric magnetic field generated by ionospheric currents reaches its maximum intensity at dayside, while in the nightside ionosphere it is the draped IMF that dominates the
The observed positive correlation between
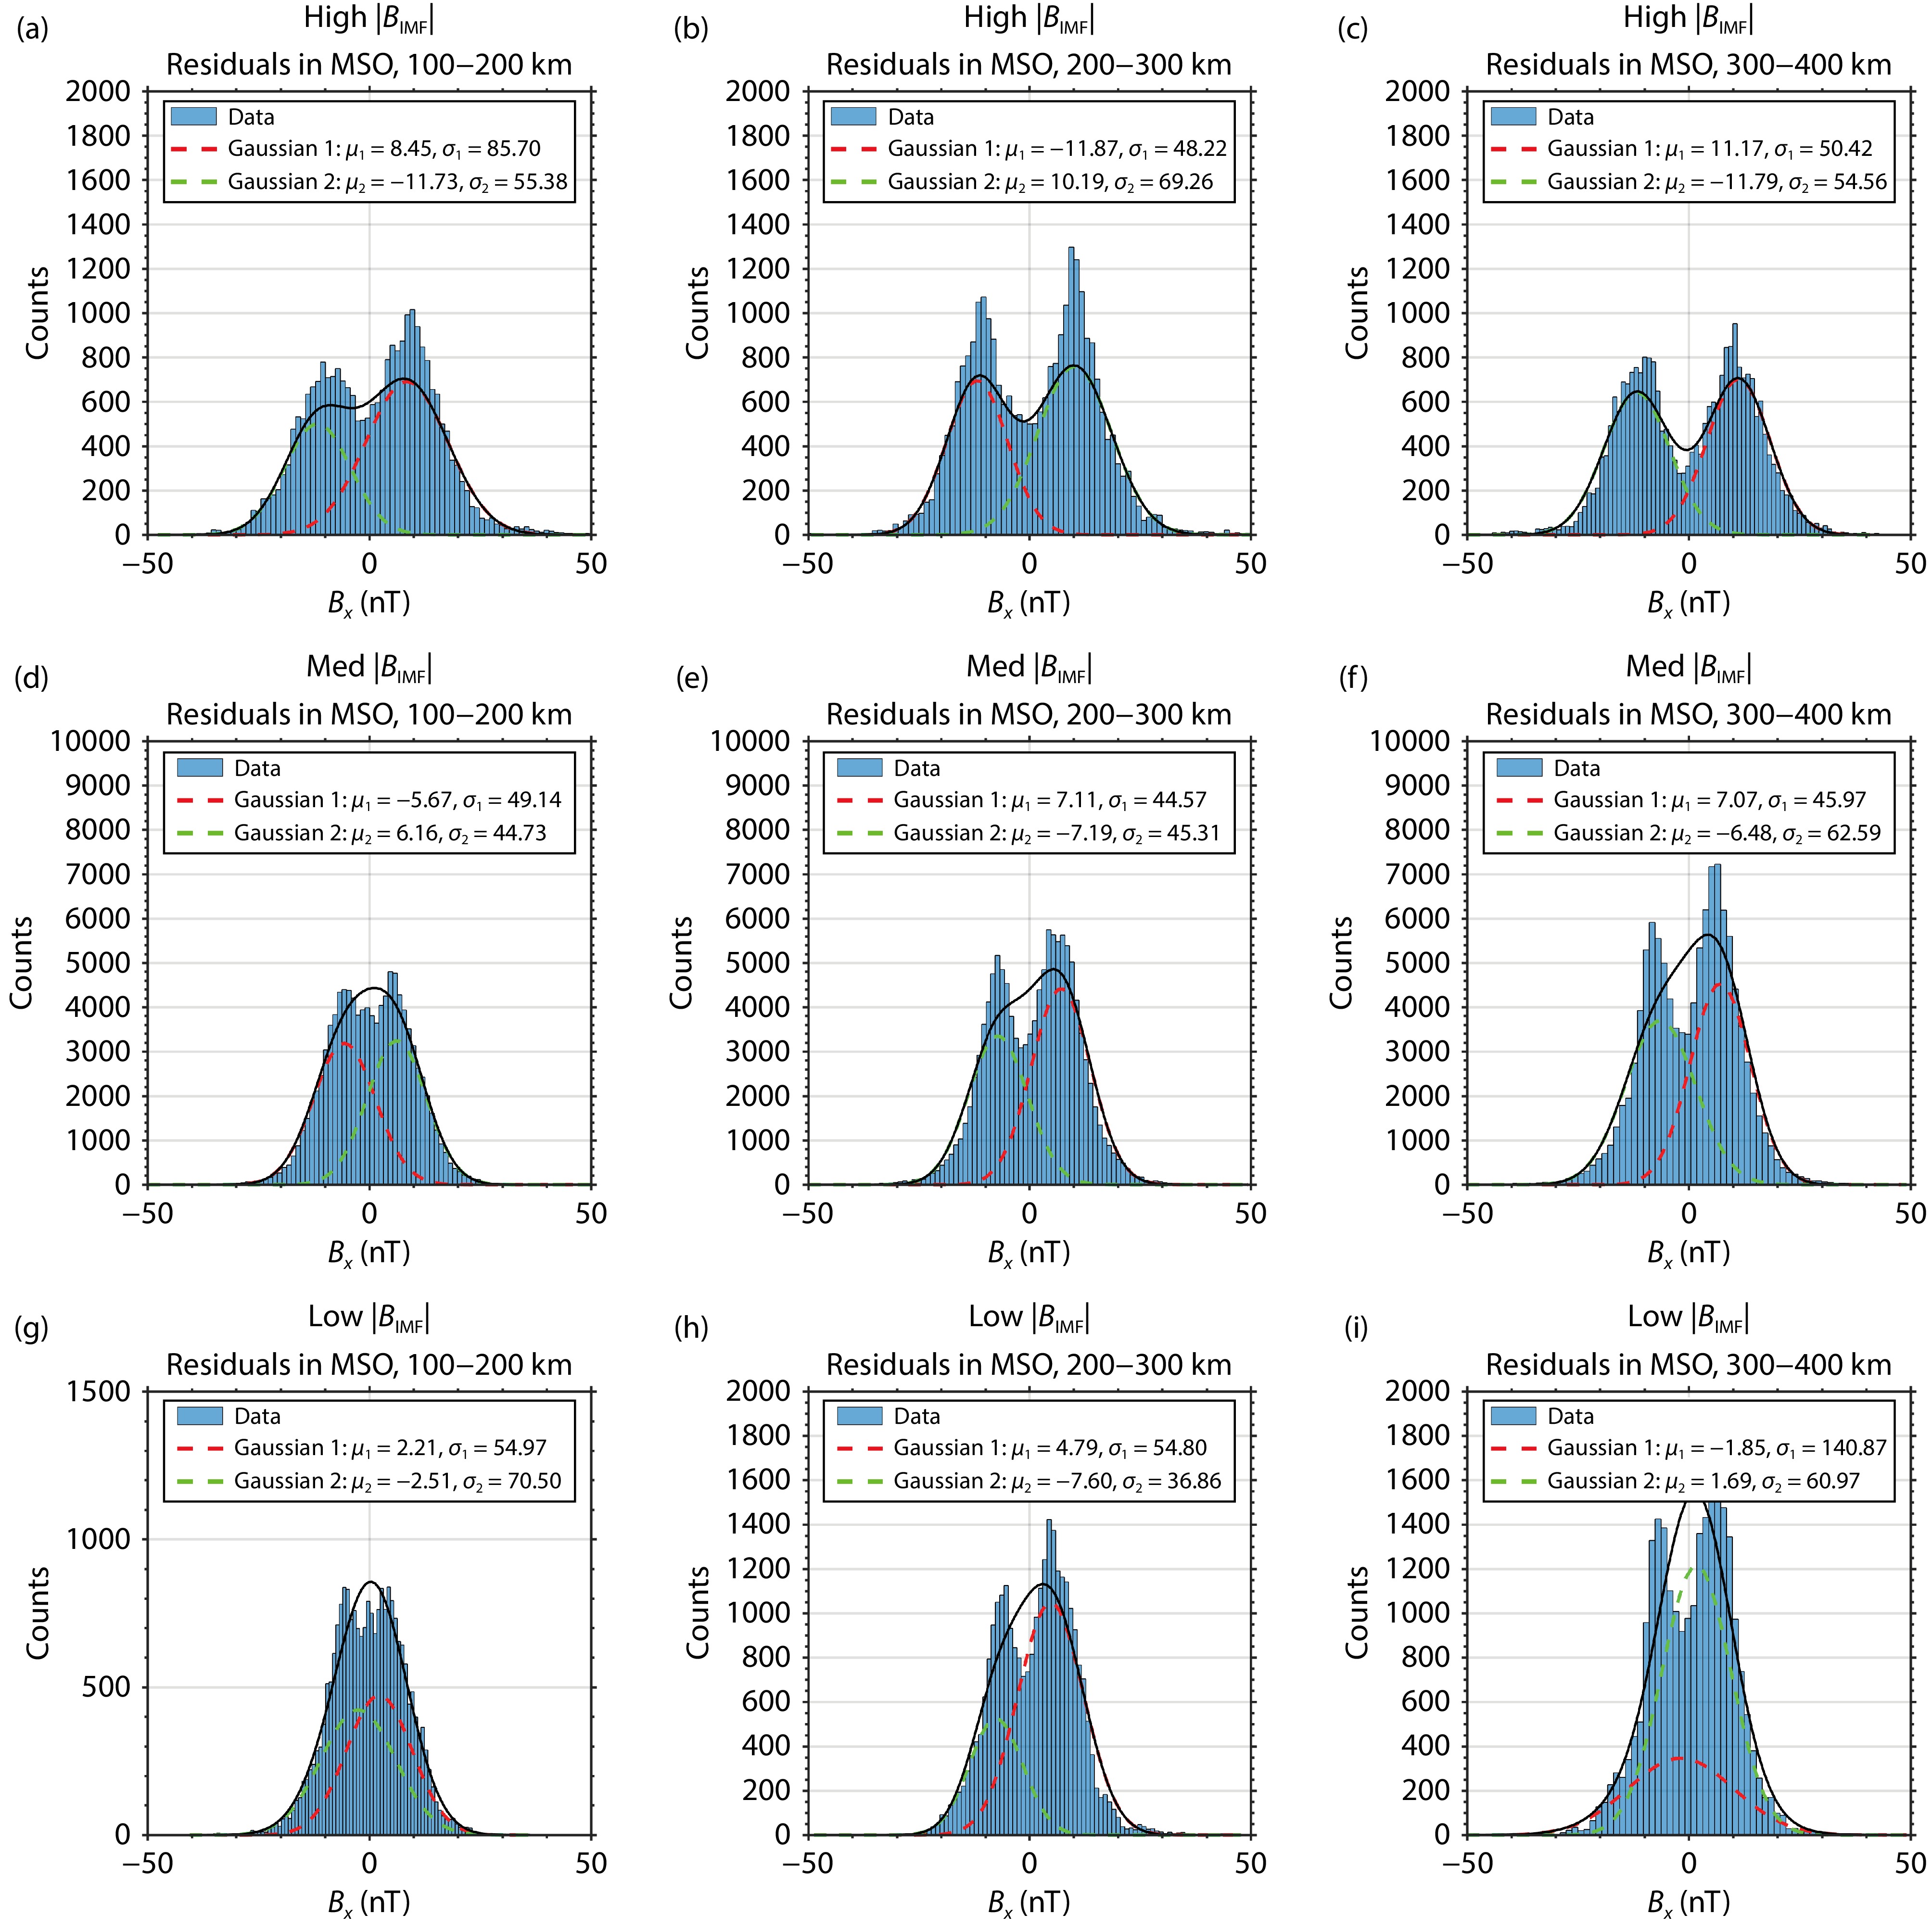
Figure 9 and Figure 10 indicate that the altitude at which the IMF penetrates the Martian nightside ionosphere varies in response to multiple external factors. The IMF can reach an altitude of 100−200 km under high and medium
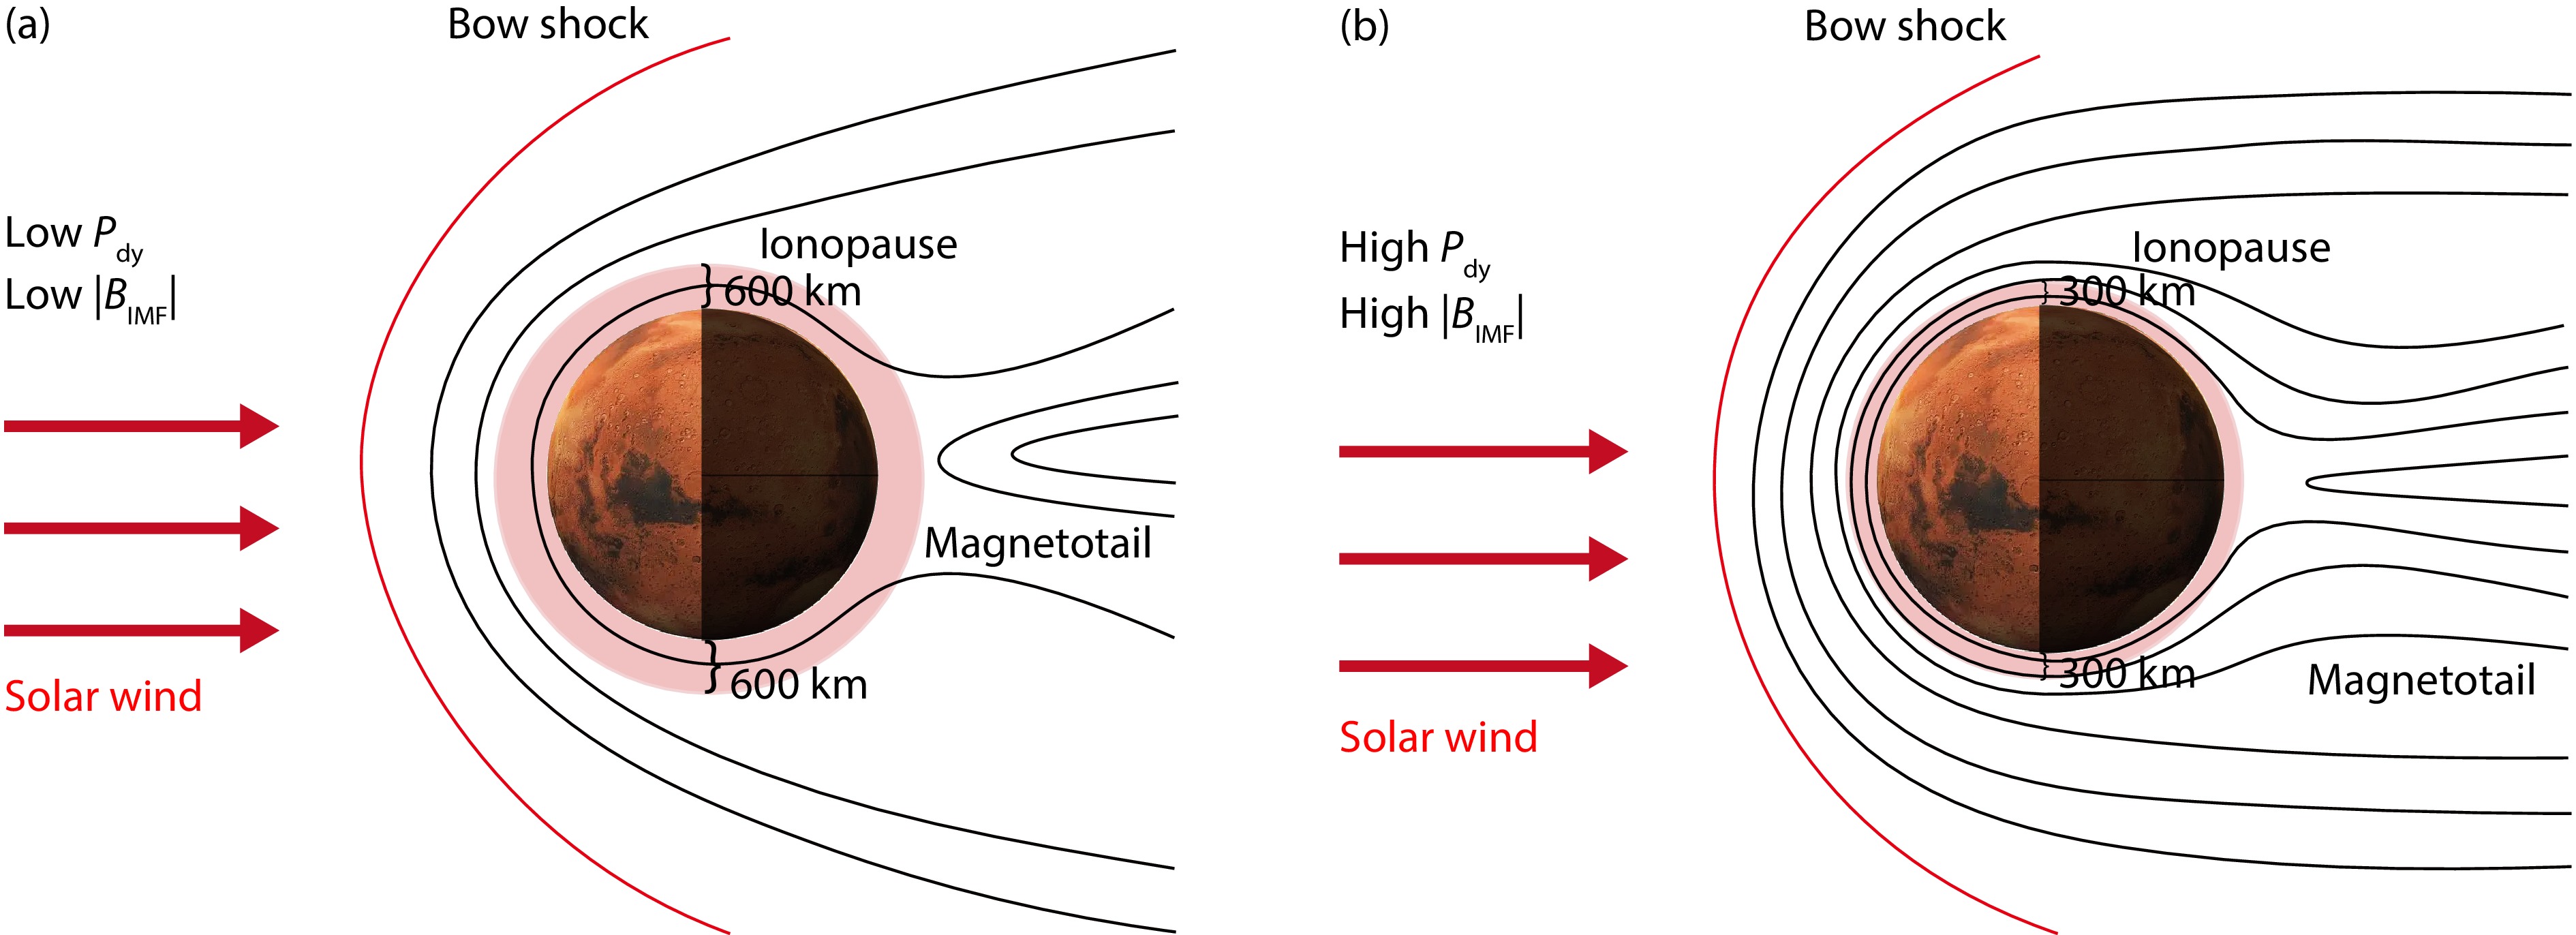
Our findings in this study are summarized in Figure 13, which illustrates the configuration of the magnetic field around Mars under varied
Lastly, regarding the modeling of the internal magnetic field, we establish a selection criterion indicating that the magnetic condition is ‘quiet’, signifying that the external magnetic field is relatively weak and, consequently, the magnetic field residuals are relatively smaller. Previous studies have demonstrated that
This work is supported by the National Natural Science Foundation of China (Grant No.
|
Acuña, M. H., Connerney, J. E. P., Ness, N. F., Lin, R. P., Mitchell, D., Carlson, C. W., McFadden, J., Anderson, K. A., Reme, H., … Cloutier, P. (1999). Global distribution of crustal magnetization discovered by the Mars global surveyor MAG/ER experiment. Science, 284(5415), 790–793. https://doi.org/10.1126/science.284.5415.790
|
|
Barabash, S., Fedorov, A., Lundin, R., and Sauvaud, J. A. (2007). Martian atmospheric erosion rates. Science, 315(5811), 501–503. https://doi.org/10.1126/science.1134358
|
|
Brain, D. A., Bagenal, F., Acuña, M. H., and Connerney, J. E. P. (2003). Martian magnetic morphology: Contributions from the solar wind and crust. J. Geophys. Res.: Space Phys., 108(A12), 1424. https://doi.org/10.1029/2002JA009482
|
|
Brain, D. A., Barabash, S., Bougher, S. W., Duru, F., Jakosky, B., and Modolo, R. (2017). Solar wind interaction and atmospheric escape. In R. M. Haberle, et al. (Eds.), The Atmosphere and Climate of Mars (pp. 464-496). Cambridge: Cambridge University Press. https://doi.org/10.1017/9781139060172.015
|
|
Brain, D. A., Weber, T., Xu, S., Mitchell, D. L., Lillis, R. J., Halekas, J. S., Espley, J., and Jakosky, B. M. (2020). Variations in nightside magnetic field topology at Mars. Geophys. Res. Lett., 47(19), e2020GL088921. https://doi.org/10.1029/2020GL088921
|
|
Burne, S., Bertucci, C., Mazelle, C., Morales, L. F., Meziane, K., Halekas, J., Fowler, C. M., Espley, J., Mitchell, D., and Penou, E. (2021). The structure of the Martian quasi-perpendicular supercritical shock as seen by MAVEN. J. Geophys. Res.: Space Phys., 126(9), e2020JA028938. https://doi.org/10.1029/2020JA028938
|
|
Byrd, S., Girazian, Z., and Ruhunusiri, S. (2024). Properties of Mars’ dayside low- altitude induced magnetic field and comparisons with Venus. J. Geophys. Res.: Space Phys., 129(3), e2023JA032343. https://doi.org/10.1029/2023JA032343
|
|
Carr, M. H., and Head III, J. W. (2003) Oceans on Mars: An assessment of the observational evidence and possible fate. J. Geophys. Res.: Planets, 108(E5), 5042. https://doi.org/10.1029/2002JE001963
|
|
Connerney, J. E. P., Acuna, M. H., Wasilewski, P. J., Ness, N. F., Rème, H., Mazelle, C., Vignes, D., Lin, R. P., Mitchell, D. L., and Cloutier, P. A. (1999). Magnetic lineations in the ancient crust of Mars. Science, 284(5415), 794–798. https://doi.org/10.1126/science.284.5415.794
|
|
Connerney, J. E. P., Espley, J. R., DiBraccio, G. A., Gruesbeck, J. R., Oliversen, R. J., Mitchell, D. L., Halekas, J., Mazelle, C., Brain, D., and Jakosky, B. M. (2015a). First results of the MAVEN magnetic field investigation. Geophys. Res. Lett., 42(21), 8819–8827. https://doi.org/10.1002/2015GL065366
|
|
Connerney, J. E. P., Espley, J., Lawton, P., Murphy, S., Odom, J., Oliversen, R., and Sheppard, D. (2015b). The MAVEN magnetic field investigation. Space Sci. Rev., 195(1-4), 257–291. https://doi.org/10.1007/s11214-015-0169-4
|
|
Crider, D. H., Vignes, D., Krymskii, A. M., Breus, T. K., Ness, N. F., Mitchell, D. L., Slavin, J. A., and Acuña, M. H. (2003). A proxy for determining solar wind dynamic pressure at Mars using Mars Global Surveyor data. J. Geophys. Res.: Space Phys., 108(A12), 1461. https://doi.org/10.1029/2003JA009875
|
|
Curry, S. M., Luhmann, J. G., Ma, Y. J., Dong, C. F., Brain, D., Leblanc, F., Modolo, R., Dong, Y., Mcfadden, J., … Jakosky, B. (2015). Response of Mars O+ pickup ions to the 8 March 2015 ICME: Inferences from MAVEN data-based models. Geophys. Res. Lett., 42(21), 9095–9102. https://doi.org/10.1002/2015GL065304
|
|
Eparvier, F. G., Chamberlin, P. C., Woods, T. N., and Thiemann, E. M. B. (2015). The solar extreme ultraviolet monitor for MAVEN. Space Sci. Rev., 195(1-4), 293–301. https://doi.org/10.1007/s11214-015-0195-2
|
|
Fang, X. H., Ma, Y. J., Luhmann, J., Dong, Y. X., Halekas, J., and Curry, S. (2023). Mars global distribution of the external magnetic field and its variability: MAVEN observation and MHD prediction. J. Geophys. Res.: Space Phys., 128(9), e2023JA031588. https://doi.org/10.1029/2023JA031588
|
|
Ferguson, B. B., Cain, J. C., Crider, D. H., Brain, D. A., and Harnett, E. M. (2005). External fields on the nightside of Mars at Mars Global Surveyor mapping altitudes. Geophys. Res. Lett., 32(16), L16105. https://doi.org/10.1029/2004GL021964
|
|
Fowler, C. M., Lee, C. O., Xu, S., Mitchell, D. L., Lillis, R., Weber, T., Halekas, J., Andersson, L., Espley, J., … Luhmann, J. (2019). The penetration of draped magnetic field into the Martian upper ionosphere and correlations with upstream solar wind dynamic pressure. J. Geophys. Res.: Space Phys., 124(4), 3021–3035. https://doi.org/10.1029/2019JA026550
|
|
Fowler, C. M., Shaver, S., Hanley, K. G., Andersson, L., McFadden, J., Mitchell, D., Halekas, J., Ma, Y., Espley, J., and Curry, S. (2024). Disappearing solar wind at Mars: Changes in the Mars-solar wind interaction. J. Geophys. Res.: Space Phys., 129(1), e2023JA031910. https://doi.org/10.1029/2023JA031910
|
|
Futaana, Y., Wieser, G. S., Barabash, S., and Luhmann, J. G. (2017). Solar wind interaction and impact on the Venus atmosphere. Space Sci. Rev., 212(3-4), 1453–1509. https://doi.org/10.1007/s11214-017-0362-8
|
|
Gao, J. W., Rong, Z. J., Klinger, L., Li, X. Z., Liu, D., and Wei, Y. (2021). A spherical harmonic Martian crustal magnetic field model combining data sets of MAVEN and MGS. Earth Space Sci., 8(10), e2021EA001860. https://doi.org/10.1029/2021EA001860
|
|
Gao, J. W. (2021). gaojiawei321/Mars_G110_model: Mars_G110_model (2.1). Zenodo. https://doi.org/10.5281/zenodo.5528845
|
|
Garnier, P., Jacquey, C., Gendre, X., Génot, V., Mazelle, C., Fang, X., Gruesbeck, J. R., Sánchez-cano, B., and Halekas, J. S. (2022). The drivers of the Martian bow shock location: A statistical analysis of Mars atmosphere and volatile EvolutioN and Mars express observations. J. Geophys. Res.: Space Phys., 127(5), e2021JA030147. https://doi.org/10.1029/2021JA030147
|
|
Girazian, Z., Halekas, J., and Lillis, R. J. (2023). Solar cycle and seasonal variability of the nightside ionosphere of Mars: Insights from five years of MAVEN observations. Icarus, 393, 114615. https://doi.org/10.1016/j.icarus.2021.114615
|
|
Gruesbeck, J. R., Espley, J. R., Connerney, J. E. P., DiBraccio, G. A., Soobiah, Y. I., Brain, D., Mazelle, C., Dann, J., Halekas, J., and Mitchell, D. L. (2018). The three-dimensional bow shock of Mars as observed by MAVEN. J. Geophys. Res.: Space Phys., 123(6), 4542–4555. https://doi.org/10.1029/2018JA025366
|
|
Halekas, J. S., Taylor, E. R., Dalton, G., Johnson, G., Curtis, D. W., McFadden, J. P., Mitchell, D. L., Lin, R. P., and Jakosky, B. M. (2015). The solar wind ion analyzer for MAVEN. Space Sci. Rev., 195(1-4), 125–151. https://doi.org/10.1007/s11214-013-0029-z
|
|
Huang, J. P., Hao, Y. Q., Lu, H. Y., and Cui, J. (2023). Variability of draped interplanetary magnetic field in the subsolar Martian ionosphere. Astrophys. J., 955(1), 48. https://doi.org/10.3847/1538-4357/acee72
|
|
Jakosky, B. M., and Phillips, R. J. (2001). Mars’ volatile and climate history. Nature, 412(6843), 237–244. https://doi.org/10.1038/35084184
|
|
Jakosky, B. M., Lin, R. P., Grebowsky, J. M., Luhmann, J. G., Mitchell, D. F., Beutelschies, G., Priser, T., Acuna, M., Andersson, L., .. Zurek, R. (2015). The Mars atmosphere and volatile evolution (MAVEN) mission. Space Sci. Rev., 195(1), 3–48. https://doi.org/10.1007/s11214-015-0139-x
|
|
Jakosky, B. M., Slipski, M., Benna, M., Mahaffy, P., Elrod, M., Yelle, R., Stone, S., and Alsaeed, N. (2017). Mars’ atmospheric history derived from upper-atmosphere measurements of 38Ar/36Ar. Science, 355(6332), 1408–1410. https://doi.org/10.1126/science.aai7721
|
|
Kulikov, Y. N., Lammer, H., Lichtenegger, H. I. M., Penz, T., Breuer, D., Spohn, T., Lundin, R., and Biernat, H. K. (2007). A comparative study of the influence of the active young sun on the early atmospheres of Earth, Venus, and Mars. Space Sci. Rev., 129(1-3), 207–243. https://doi.org/10.1007/s11214-007-9192-4
|
|
Lillis, R. J., Fillingim, M. O., Ma, Y., Gonzalez-Galindo, F., Forget, F., Johnson, C. L., Mittelholz, A., Russell, C. T., Andersson, L. and Fowler, C. M. (2019). Modeling wind-driven ionospheric dynamo currents at Mars: Expectations for InSight magnetic field measurements. Geophys. Res. Lett., 46, 5083–5091. https://doi.org/10.1029/2019GL082536
|
|
Lillis, R. J., Xu, S., Mitchell, D., Thiemann, E., Eparvier, F., Benna, M., and Elrod, M. (2021). Ionization efficiency in the dayside ionosphere of Mars: Structure and variability. J. Geophys. Res.: Planets, 126(12), e2021JE006923. https://doi.org/10.1029/2021JE006923
|
|
Liu, D., Rong, Z. J., Gao, J. W., He, J. S., Klinger, L., Dunlop, M. W., Yan, L. M., Fan, K., and Wei, Y. (2021). Statistical properties of solar wind upstream of Mars: MAVEN observations. Astrophys. J., 911(2), 113. https://doi.org/10.3847/1538-4357/abed50
|
|
Lloyd, S. (1982). Least squares quantization in PCM. IEEE Trans. Inf. Theory, 28(2), 129–137. https://doi.org/10.1109/TIT.1982.1056489
|
|
Luhmann, J. G., Elphic, R. C., Russell, C. T., Mihalov, J. D., and Wolfe, J. H. (1980). Observations of large scale steady magnetic fields in the dayside Venus ionosphere. Geophys. Res. Lett., 7(11), 917–920. https://doi.org/10.1029/GL007i011p00917
|
|
Luhmann, J. G., Elphic, R. C., Russell, C. T., Slavin, J. A., and Mihalov, J. D. (1981). Observations of large scale steady magnetic fields in the nightside Venus ionosphere and near wake. Geophys. Res. Lett., 8(5), 517–520. https://doi.org/10.1029/GL008i005p00517
|
|
Luhmann, J. G., and Cravens, T. E. (1991). Magnetic fields in the ionosphere of Venus. Space Sci. Rev., 55(1-4), 201–274. https://doi.org/10.1007/BF00177138
|
|
Luhmann, J. G., Ledvina, S. A., and Russell, C. T. (2004). Induced magnetospheres. Adv. Space Res., 33(11), 1905–1912. https://doi.org/10.1016/j.asr.2003.03.031
|
|
Luhmann, J. G., Dong, C. F., Ma, Y. J., Curry, S. M., Xu, S., Lee, C. O., Hara, T., Halekas, J., Li, Y., … Jakosky, B. M. (2017). Martian magnetic storms. J. Geophys. Res.: Space Phys., 122(6), 6185–6209. https://doi.org/10.1002/2016JA023513
|
|
Lundin, R. (2011). Ion acceleration and outflow from Mars and Venus: An overview. Space. Sci. Rev., 162(1-4), 309–334. https://doi.org/10.1007/s11214-011-9811-y
|
|
Luo, H., Du, A. M., Zhang, S. H., Ge, Y. S., Zhang, Y., Sun, S. Q., Zhao, L., Tian, L., and Li, S. Y. (2022). On the source of the quasi-Carrington Rotation periodic magnetic variations on the Martian surface: InSight observations and modeling. Earth Planet. Phys., 6(3), 275–283. https://doi.org/10.26464/epp2022022
|
|
McLachlan, G. J., Lee, S. X., and Rathnayake, S. I. (2019). Finite mixture models. Annu. Rev. Stat. Appl., 6, 355–378. https://doi.org/10.1146/annurev-statistics-031017-100325
|
|
Mittelholz, A., Johnson, C. L., and Lillis, R. J. (2017). Global-scale external magnetic fields at Mars measured at satellite altitude. J. Geophys. Res.: Planets, 122(6), 1243–1257. https://doi.org/10.1002/2017JE005308
|
|
Mittelholz, A., Johnson, C. L., and Morschhauser, A. (2018). A new magnetic field activity proxy for Mars from MAVEN data. Geophys. Res. Lett., 45(12), 5899–5907. https://doi.org/10.1029/2018GL078425
|
|
Mittelholz, A., Johnson, C. L., Thorne, S. N., Joy, S., Barrett, E., Fillingim, M. O., Forget, F., Langlais, B., Russell, C. T., … Banerdt, W. B. (2020). The origin of observed magnetic variability for a sol on Mars from InSight. J. Geophys. Res.: Planets, 125(9), e2020JE006505. https://doi.org/10.1029/2020JE006505
|
|
Mittelholz, A., and Johnson, C. L. (2022). The Martian crustal magnetic field. Front. Astron. Space Sci., 9, 895362. https://doi.org/10.3389/fspas.2022.895362
|
|
Montabone, L., Forget, F., Millour, E., Wilson, R. J., Lewis, S. R., Cantor, B., Kass, D., Kleinböhl, A., Lemmon, M. T., … Wolff, M. J. (2015). Eight-year climatology of dust optical depth on Mars. Icarus, 251, 65–95. https://doi.org/10.1016/j.icarus.2014.12.034
|
|
Ramstad, R., and Barabash, S. (2021). Do intrinsic magnetic fields protect planetary atmospheres from stellar winds?. Space Sci. Rev., 217(2), 36. https://doi.org/10.1007/s11214-021-00791-1
|
|
Riousset, J. A., Paty, C. S., Lillis, R. J., Fillingim, M. O., England, S. L., Withers, P. G., and Hale, J. P. M. (2014). Electrodynamics of the Martian dynamo region near magnetic cusps and loops. Geophys. Res. Lett., 41(4), 1119–1125. https://doi.org/10.1002/2013GL059130
|
|
Rong, Z. J., Stenberg, G., Wei, Y., Chai, L. H., Futaana, Y., Barabash, S., Wan, W. X., and Shen, C. (2016). Is the flow-aligned component of IMF really able to impact the magnetic field structure of Venusian magnetotail?. J. Geophys. Res.: Space Phys., 121(11), 10978–10993. https://doi.org/10.1002/2016JA022413
|
|
Sánchez-Cano, B., Narvaez, C., Lester, M., Mendillo, M., Mayyasi, M., Holmstrom, M., Halekas, J., Andersson, L., Fowler, C. M., … Durward, S. (2020). Mars’ ionopause: A matter of pressures. J. Geophys. Res.: Space Phys., 125(9), e2020JA028145. https://doi.org/10.1029/2020JA028145
|
|
Shuvalov, S., Andersson, L., Halekas, J. S., Fowler, C. M., Hanley, K. G., and DiBraccio, G. (2024). Ionospheric plasma transported into the Martian magnetosheath. Geophys. Res. Lett., 51(6), e2023GL107953. https://doi.org/10.1029/2023GL107953
|
|
Thiemann, E. M. B., Chamberlin, P. C., Eparvier, F. G., Templeman, B., Woods, T. N., Bougher, S. W., and Jakosky, B. M. (2017). The MAVEN EUVM model of solar spectral irradiance variability at Mars: Algorithms and results. J. Geophys. Res.: Space Phys, 122(3), 2748–2767. https://doi.org/10.1002/2016JA023512
|
|
Trotignon, J. G., Mazelle, C., Bertucci, C., and Acuña, M. H. (2006). Martian shock and magnetic pile-up boundary positions and shapes determined from the Phobos 2 and Mars Global Surveyor data sets. Planet. Space Sci., 54(4), 357–369. https://doi.org/10.1016/j.pss.2006.01.003
|
|
Weber, T., Brain, D., Mitchell, D., Xu, S. S., Espley, J., Halekas, J., Lillis, R., and Jakosky, B. (2019). The influence of solar wind pressure on Martian crustal magnetic field topology. Geophys. Res. Lett., 46(5), 2347–2354. https://doi.org/10.1029/2019GL081913
|
|
Withers, P., Flynn, C. L., Vogt, M. F., Mayyasi, M., Mahaffy, P., Benna, M., Elrod, M., Mcfadden, J. P., Dunn, P., …England, S. (2019). Mars’s dayside upper ionospheric composition is affected by magnetic field conditions. J. Geophys. Res.: Space Phys., 124(4), 3100–3109. https://doi.org/10.1029/2018JA026266
|
|
Xu, S. S., Mitchell, D., Liemohn, M., Fang, X. H., Ma, Y. J., Luhmann, J., Brain, D., Steckiewicz, M., Mazelle, C., … Jakosky, B. (2017). Martian low-altitude magnetic topology deduced from MAVEN/SWEA observations. J. Geophys. Res.: Space Phys., 122(2), 1831–1852. https://doi.org/10.1002/2016JA023467
|
|
Zhang, C., Rong, Z. J., Klinger, L., Nilsson, H., Shi, Z., He, F., Gao, J. W., Li, X. Z., Futaana, Y., … Wei, Y. (2022). Three-dimensional configuration of induced magnetic fields around Mars. J. Geophys. Res.: Planets, 127(8), e2022JE007334. https://doi.org/10.1029/2022JE007334
|
|
Zhang, Q., Holmström, M., Wang, X. D., Nilsson, H., and Barabash, S. (2023). The influence of solar irradiation and solar wind conditions on heavy ion escape from Mars. J. Geophys. Res.: Space Phys., 128(10), e2023JA031828. https://doi.org/10.1029/2023JA031828
|
| S. Williams, D. Gubbins, P. W. Livermore, Y. Jiang. 2025: Evaluation of the lithospheric magnetic field mapped by the first year of MSS-1 data. Earth and Planetary Physics, 9(3): 1-8. DOI: 10.26464/epp2025033 | |
| Anwar Santoso, Sismanto Sismanto, Rhorom Priyatikanto, Eddy Hartantyo, Dyah R. Martiningrum. 2025: The intensity of geomagnetic storms associated with the interplanetary magnetic field and solar wind parameters during Solar Cycle 24. Earth and Planetary Physics, 9(2): 375-386. DOI: 10.26464/epp2024069 | |
| Jie Wang, YanYan Yang, ZhiMa Zeren, JianPing Huang, HengXin Lu. 2025: Evaluation of influence of detrending CSES satellite data on lithospheric magnetic field modeling. Earth and Planetary Physics, 9(2): 346-356. DOI: 10.26464/epp2024068 | |
| GuoQiang Wang, SuDong Xiao, MingYu Wu, YuanQiang Chen, TieLong Zhang. 2024: Statistical study of magnetic holes in the upstream region of Mercury’s bow shock. Earth and Planetary Physics, 8(2): 326-337. DOI: 10.26464/epp2024013 | |
| Andrey Samsonov, Graziella Branduardi-Raymont, Steven Sembay, Andrew Read, David Sibeck, Lutz Rastaetter. 2024: Simulation of the SMILE Soft X-ray Imager response to a southward interplanetary magnetic field turning. Earth and Planetary Physics, 8(1): 39-46. DOI: 10.26464/epp2023058 | |
| YuanQiang Chen, MingYu Wu, YangJun Chen, SuDong Xiao, GuoQiang Wang, TieLong Zhang. 2023: Responses of the field-aligned currents in the plasma sheet boundary layer to a geomagnetic storm. Earth and Planetary Physics, 7(5): 558-564. DOI: 10.26464/epp2023075 | |
| Hui Xiao, ZhiHong Zhong, Meng Zhou, YongYuan Yi, LiangJin Song, Ye Pang, XiaoHua Deng. 2023: The effect of the guide field on energy conversion during collisionless magnetic reconnection. Earth and Planetary Physics, 7(4): 436-444. DOI: 10.26464/epp2023043 | |
| PengFei Liu, Yi Jiang, Qing Yan, Ann M. Hirt. 2023: The behavior of a lithospheric magnetization and magnetic field model. Earth and Planetary Physics, 7(1): 66-73. DOI: 10.26464/epp2023025 | |
| YangGuang Ke, QuanMing Lu, XinLiang Gao, HuaYue Chen, Rui Chen. 2022: Ray-tracing simulations of whistler-mode wave propagation in different rescaled dipole magnetic fields. Earth and Planetary Physics, 6(6): 555-562. DOI: 10.26464/epp2022048 | |
| ShiBang Li, HaoYu Lu, Jun Cui, YiQun Yu, Christian Mazelle, Yun Li, JinBin Cao. 2020: Effects of a dipole-like crustal field on solar wind interaction with Mars. Earth and Planetary Physics, 4(1): 23-31. DOI: 10.26464/epp2020005 |
