Franco, A. M. S., Echer, E., Bolzan, M. J. A., and Fraenz, M. (2022). Study of fluctuations in the Martian magnetosheath using a kurtosis technique: Mars Express observations. Earth Planet. Phys., 6(1), 28–41. DOI: 10.26464/epp2022006
Citation:
Franco, A. M. S., Echer, E., Bolzan, M. J. A., and Fraenz, M. (2022). Study of fluctuations in the Martian magnetosheath using a kurtosis technique: Mars Express observations. Earth Planet. Phys., 6(1), 28–41. DOI: 10.26464/epp2022006
The kurtosis parameter in the electron temperature and density data indicates intermittence in the Martian magnetosheath.
Kurtosis is higher in the scales near the proton gyrofrequency in the upstream region, emphasizing the influence of upstream events that can transfer energy to the induced magnetosphere.
Kurtosis parameters show a significant solar cycle phase dependence, which is higher in the declining and maximum phases.
Planetary magnetosheaths are characterized by high plasma wave and turbulence activity. The Martian magnetosheath is no exception; both upstream and locally generated plasma waves have been observed in the region between its bow shock and magnetic boundary layer, its induced magnetosphere. This statistical study of wave activity in the Martian magnetosheath is based on 12 years (2005–2016) of observations made during Mars Express (MEX) crossings of the planet’s magnetosheath — in particular, data on electron density and temperature data collected by the electron spectrometer (ELS) of the plasma analyzer (ASPERA-3) experiment on board the MEX spacecraft. A kurtosis parameter has been calculated for these plasma parameters. This value indicates intermittent behavior in the data when it is higher than 3 (the value for a normal or Gaussian distribution). The variation of wave activity occurrence has been analyzed in relation to solar cycle, Martian orbit, and distance to the bow shock. Non-Gaussian properties are observed in the magnetosheath of Mars on all analyzed scales, especially in those near the proton gyrofrequency in the upstream region of the Martian magnetosphere. We also report that non-Gaussian behavior is most prominent at the smaller scales (higher frequencies). A significant influence of the solar cycle was also observed; the kurtosis parameter is higher during declining and solar maximum phases, when the presence of disturbed solar wind conditions, caused by large scale solar wind structures, increases. The kurtosis decreases with increasing distance from the bow shock, which indicates that the intermittence level is higher near the bow shock. In the electron temperature data the kurtosis is higher near the perihelion due to the higher incidence of EUV when the planet is closer to the Sun, which causes a more extended exosphere, and consequently increases the wave activity in the magnetosheath and its upstream region. The extended exosphere seems to play a lower effect in the electron density data.
The solar wind is a supermagnetosonic plasma flowing away from the Sun, composed mainly of protons and electrons. It carries a frozen-in magnetic field, the interplanetary magnetic field (IMF) (Hundhausen, 1972; Formisano, 1984). When the solar wind encounters an electromagnetic conducting body in our solar system, the solar wind flow is deflected and compressed around the planet (Cravens, 1997; Echer et al., 2005) and upstream of the obstacle a bow shock is formed by the reflection of plasma waves. Between the bow shock and the obstacle, a turbulent region evolves, the magnetosheath, filled by the submagnetosonic compressed and heated plasma flow that passes though the boundary (Leckband et al., 1995; Richardson, 2002). The magnetosheath is a region with a significant influx of energy from the solar wind. In addition to the conversion of part of kinetic energy into heat, the energy of plasma and magnetic field oscillations is also intensified in the magnetosheath (Luhmann et al., 1986; Kozak et al., 2011).
There are upstream sources of turbulence, as particles are reflected at the bow shock and form the “ion foreshock” (Tsurutani and Rodriguez, 1981). These particles drive instabilities in the magnetosheath region, but they are not the only causes of waves in the magnetosheath. Local instabilities can also generate and intensify these oscillations, since strong temperature anisotropy is caused by the presence of the magnetospheric boundaries (Schwartz et al., 1996). Observations of the Earth’s magnetosheath have revealed that waves can also be generated by physical processes occurring within the magnetopause and the magnetosphere (Lacombe and Belmont, 1995). Recently, Bolzan (2018), using a very simple model based on Self Organizing Criticality (SOC) for the Earth’s magnetosphere, showed that the kurtosis parameter for time series without strong geomagnetic disturbance is higher at small scales compared to greater scales. For time series when geomagnetic disturbance is strong, however, his results shown higher value in the 24 h scale, indicating influence of the introduction of strong energy inside the system. Thus, the plasma structure in that region is formed by complex dynamic processes which are determined by internal processes in addition to external solar wind and IMF parameters (Kozak et al., 2011).
Osmane et al. (2015), using the kurtosis analysis, have shown that mirror mode turbulence in the terrestrial magnetosheath has non-Gaussian properties. They also observed that the source of the mirror mode fluctuations does not interfere in the dynamical evolution of these structures.
In the region of the Earth’s foreshock, ultra-low frequency (ULF) waves can be divided into three types: waves with high amplitude and very low frequency (with periods of 30 seconds), whistler waves with frequency of about 1 Hz, and waves associated with the proton gyro period (around 3 seconds). The source of the waves with periods of 30 seconds is associated with ions that propagate backward against the solar wind flow in the upstream direction of the bow shock (Greenstadt et al., 1995). ULF waves generated in the interaction between the solar wind and the terrestrial magnetosphere present frequencies in the magnetosheath between 1−100 mHz, where they are convected toward the ionosphere (Sciffer et al., 2004).
Dwivedi et al. (2019) have studied turbulent dynamics of the Earth magnetosheath using spectral analysis of the Cluster magnetic field data. Those authors have shown that spectral slopes vary from values between −1.5 to 0 to scales up to 20 times the ion gyroradius and have a transition to −2.6 to −1.8 for higher frequencies.
In induced magnetospheres, as for Venus and Mars, the magnetosheath forms between the bow shock and the limit of the region where the IMF piles up around the planet, known as the magnetic pile-up boundary (MPB) (Acuña et al., 1998). Since induced magnetospheres have an extended exosphere, waves in that region can be intensified by the presence of planetary ions (Nagy et al., 2004). Studies of physical processes in planetary magnetosheaths are important because these processes can interfere with phenomena within the planetary ionosphere or magnetosphere.
Due to the absence of an intrinsic magnetic field at Mars and Venus, the ionosphere cannot deflect high energy particles completely; some of them can penetrate into the planet’s upper atmosphere (Luhmann et al., 1992, 2004). There is evidence that transients from the Martian upstream bow shock and fluctuations in the magnetosheath can propagate through the magnetic pile-up region (MPR) and accelerate ionospheric ions (Fowler et al., 2018; Collinson et al., 2018; de Souza Franco et al., 2019).
Using magnetic field and ion data from the Mars Atmosphere and Volatile Evolution spacecraft (MAVEN), Shan et al. (2020) studied a case of a fast mode ULF wave in the foreshock of Mars. They report that the peak frequency (0.040 Hz) of the waves in the spacecraft frame was about half of the observed proton gyrofrequency (~0.088 Hz). They have estimated a wavelength of ~3.8RM (RM = 3389.5 km). In the period preceding the data interval used in their analysis, a hot flow anomaly, an important foreshock transient was detected.
Recent studies have shown the importance of magnetohydrodynamic (MHD) turbulence for understanding the energy transfer between Sun and planetary magnetospheres (Bolzan and Echer, 2014; Echer and Bolzan, 2016; Banerjee et al., 2016; Andrés et al., 2020). Echer and Bolzan (2016) analyzing data from Uranus’ foreshock turbulence, have shown that intermittent waves can make significant contributions to the energy of foreshock waves. Andrés et al. (2020) have computed the energy cascade in the Martian upstream region using MAVEN data; they have observed that, for intervals exhibiting proton cyclotron wave activity around the perihelion, the nonlinear cascade at MHD scales is slightly amplified.
Ruhunusiri et al. (2017) have studied turbulence in the plasma environment of Mars using magnetic field data from MAVEN. They report that in the Martian magnetosheath the incoming solar wind is affected by the planetary bow shock, finding a transition in the spectral indices from values close to −0.5 at low frequencies to values higher than 5/3 at high frequencies. Although transients in the Martian upstream region can propagate through the magnetosheath, it is locally generated fluctuations that dominate in the magnetosheath. It is important to mention the difference due the turbulence promoted by passive scalar and vectorial variables. According to Warhaft (2000), the study of the passive scalars turbulence is important in turbulent mixing, pollution, and other processes inside the HD turbulence. For the MHD these scalars are important to understand the processes of the interaction between the solar wind and the upper planetary atmosphere. We know that the distinct turbulent variables (passive scalar and vectorial variables) are governed by also distinct equations: the vectorial quantities such as velocity variables are described by Navier-Stokes for neutral environments or MHD for plasmas (present case); passive scalars are governed by a convection–diffusion equation (Warhaft, 2000). Thus, the study of the interactions between the passive scalars inside the MHD turbulence is relatively recent, made possible by data from spacecraft launched in recent years (Banerjee et al., 2016 and references therein); this study extends that work.
Franco et al. (2020) have observed that the most energetic frequencies of electron density and temperature in the Martian magnetosheath are in the 5−20 mHz range, which is near the O+gyrofrequency. Hadid et al. (2018) used Cluster and THEMIS spacecraft data to describe the energy cascade rate for Earth’s magnetosphere, finding two kinds of turbulence: one associated with incompressible Alfvénic fluctuations and another associated with compressible magnetosonic-like fluctuations. It is the aim of this study to use a statistical approach in order to characterize wave activity among different scales within the magnetosheath of Mars, using a kurtosis technique to analyze electron density and temperature plasma data collected by the Mars Express (MEX) spacecraft.
2.
Data Analysis and Methodology
2.1
Data
The analysis conducted here was applied to 12 years (2005–2016) of data from the European Space Agency (ESA) mission, MEX. MEX was launched in the beginning of July 2003 and it is still operating in orbit around the planet as of September 2021. The MEX orbit has an elliptical trajectory around Mars, with an inclination of 86.35° and a period of about 6.75 h (Chicarro et al., 2004). Electron density and temperature data are collected by the Electron Spectrometer (ELS) of the Analyzer of Space Plasma and Energetic Atoms (ASPERA-3) experiment. The ELS is a sensor composed of a collimator system followed by a compact spherical top-hat electrostatic analyzer, which measures electrons in the energy range 0.01 to 20 keV with a time resolution of 4 seconds (Barabash et al., 2004, 2006). The plasma moments are calculated by integration and by Gaussian fits to the phase space distribution obtained from the ELS. A detailed description of how these moments are obtained is presented by Fränz et al. (2006).
Since the main goal of this work is to study wave activity in the Martian magnetosheath, a plasma boundaries catalog (Han et al., 2014; de Souza Franco, 2018) has been used in order to select the MEX magnetosheath crossings that took place in the period 2005–2016. The magnetosheath intervals used in this analysis are the same as were used in our study of the periodicities of ULF waves in the magnetosheath of Mars (Franco et al., 2020).
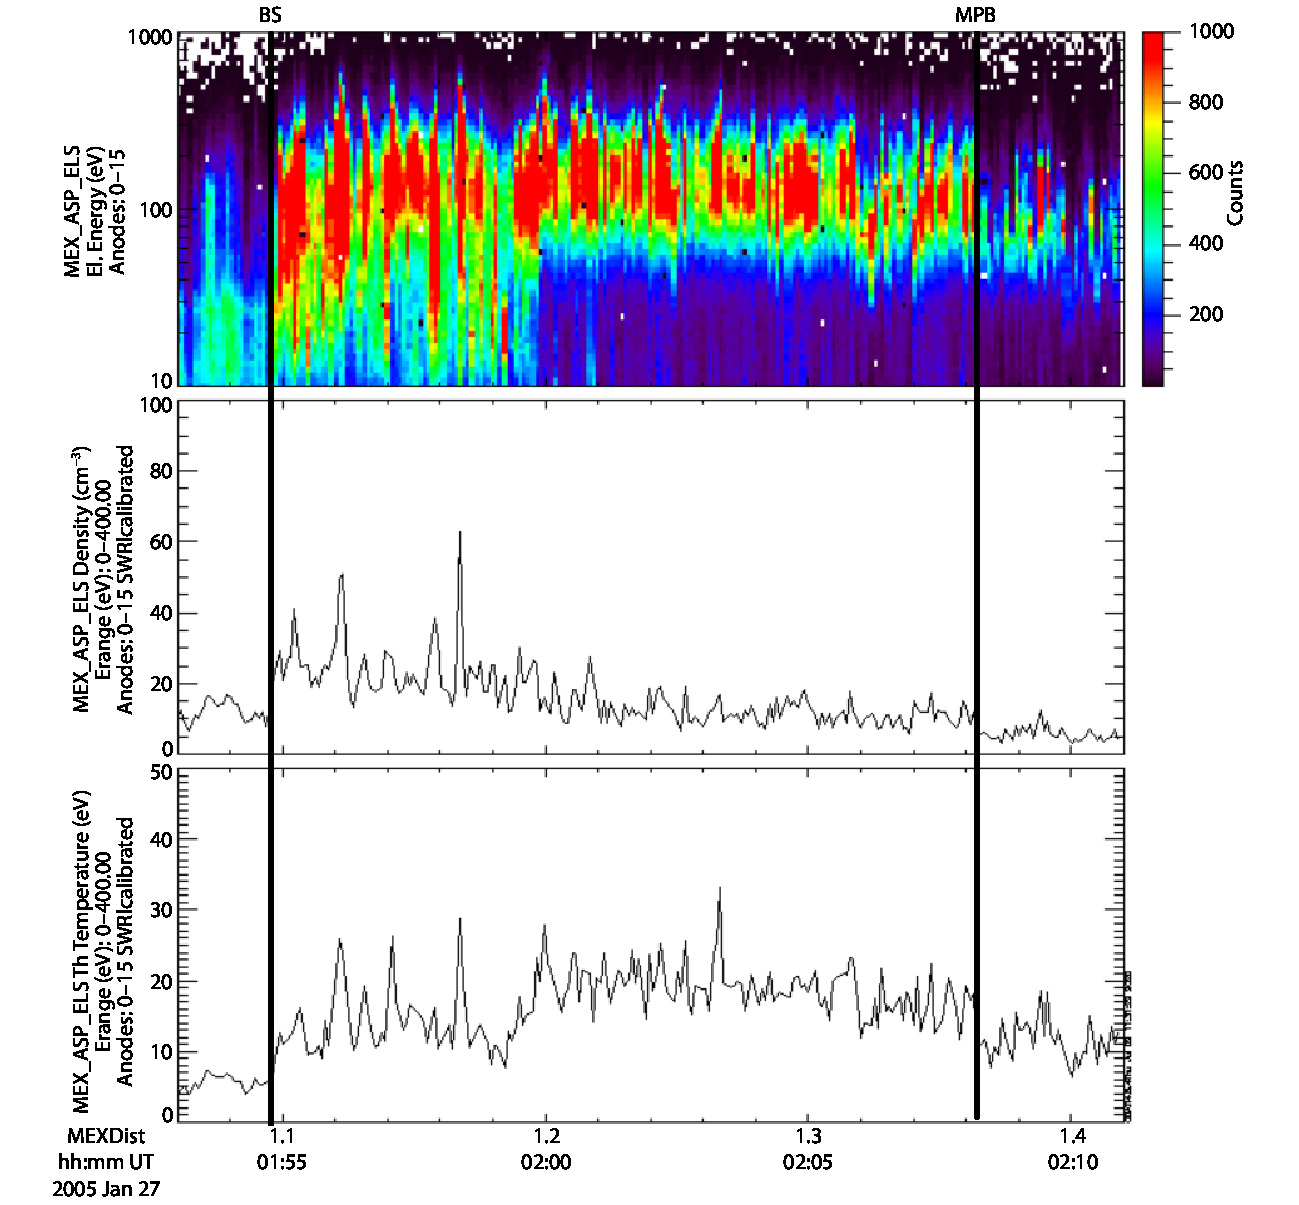
In Figure 1 we show the plots of the electron energy spectrum (top panel), electron density (middle panel), and electron temperature (bottom panel) for a MEX magnetosheath crossing that occurred on January 27, 2005. The BS and MPB positions are represented in this figure as black vertical lines.
Figure
1.
Electron energy spectrum (top panel), density (middle panel), and temperature (bottom panel) for a representative MEX magnetosheath crossing.
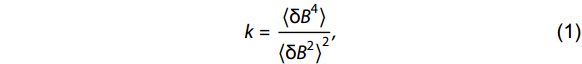
Since the original work on plasma turbulence by Kolmogorov (1962), an energy cascade has been proposed to explain the energy transfer from large scales to small ones. Such cascades play important roles both in hydrodynamics (HD) and in magnetohydrodynamics (MHD). In a turbulent plasma, energy cascades are observed: energy is injected by large-scale processes and is then transferred to smaller scales until it reaches the kinetic scales, where it is dissipated (Frisch, 1995; Chasapis et al, 2017). However, deviations from purely thermal structural fluctuations are observed, exhibiting intermittence. Intermittent structures are present in all kind of flows, indicating the presence of sporadic strong and localized fluctuations, characterized by a non-Gaussian distribution (Chhiber et al., 2018). Turbulence is unpredictable and random such that it can be studied only by using a statistical approach, for example through observations of higher-order moments in the plasma distribution. Thus, one way to identify intermittency is to determine the probability density function (PDF), looking at how it differs from a Gaussian shape and especially for the presence of enhanced high energy tails (Bolzan et al., 2002). When a distribution has a high energy tail, with strong deviations from a Gaussian distribution, a higher occurrence frequency of intermittent events is indicated, which can be an additional source of waves (Bruno et al., 2005; Bruno and Carbone, 2013). In a general way, we can define kurtosis (k) as a standardized fourth central moment of a distribution (Bolzan and Echer, 2014).
k=⟨δB4⟩⟨δB2⟩2,
(1)
where B is the variable used for the study and δB denotes the deviation from the mean of the variable observed during some time interval δt.
In the present study, we used the electron density and temperature time series with four-second time resolution. For a normal distribution (Gaussian) the expected kurtosis is equal to 3. For a time series that includes intermittent values, this statistical parameter will be higher than 3, and much higher in proportion to larger numbers of intermittent values. In our analysis, we have chosen to plot kurtosis using scales of frequency (mHz), since in this work we focus on ULF waves, having observed in our previous work (Franco et al., 2020) that these ranges are the most energetic frequencies in the magnetosheath of Mars. Accordingly, we have converted data from the time domain to the frequency domain, the scale of number of points to frequency. We have converted 6, 8, 12, 25, and 50 points to approximately 40, 30, 20, 10 and 5 (mHz), since ELS has a time resolution of 4 seconds.
3.
Results and Discussions
The kurtosis calculation was applied to the electron density and temperature data in order to study wave activity in the magnetosheath of Mars. As mentioned in the previous section, the kurtosis parameter was computed using the following frequency scales 40, 30, 20, 10, and 5 mHz. This allows us to study how the kurtosis varies with frequency. These scales used here were chosen based on the study by Franco et al. (2020), which reports that ULF waves in the electron density and temperature data are found mainly in the range between 5 and 40 mHz.
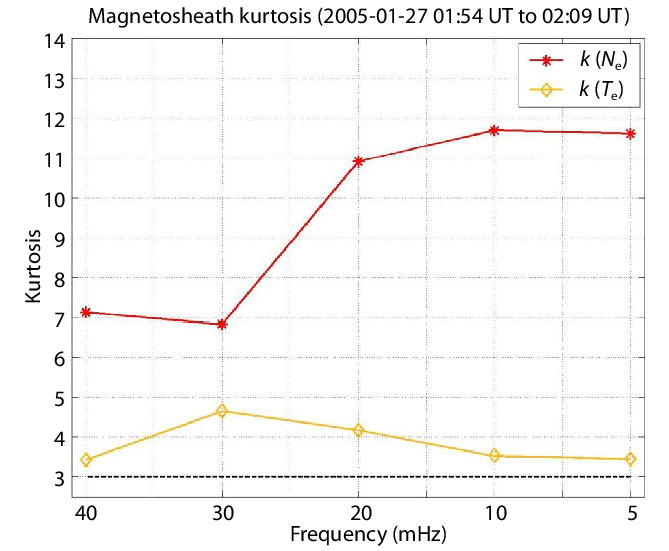
Figure 2 shows the kurtosis of Ne (red line) and Te (orange line) data from the same MEX magnetosheath crossing presented in Figure 1.
Figure
2.
Kurtosis parameters for electron density (red) and electron temperature (orange) data from the same MEX magnetosheath crossing presented in Figure 1.
From Figure 2 we can notice that kurtosis is higher than 3 for both variables in all scales. The kurtosis values for the five frequency scales presented above are: 11.6 (5 mHz), 11.7 (10 mHz), 10.9 (20 mHz), 6.8 (30 mHz), and 7.1 (40 mHz) for the electron density; for electron temperature, kurtosis values are 3.4 (5 mHz), 3.5 (10 mHz), 4.2 (20 mHz), 4.6 (30 mHz), and 3.4 (40 mHz).
The kurtosis analysis was applied to data from a total of 9617 magnetosheath crossings by the MEX spacecraft. In our results, the median kurtosis is used. The median was used instead of the mean because the data from particle counters are often influenced by instrumental disturbances that may occur only sporadically. These outliers in the data can distort not only the maximum observed values but also, obviously, the mean.
3.1
Analysis of 12 Years of MEX Observations (2005–2016)
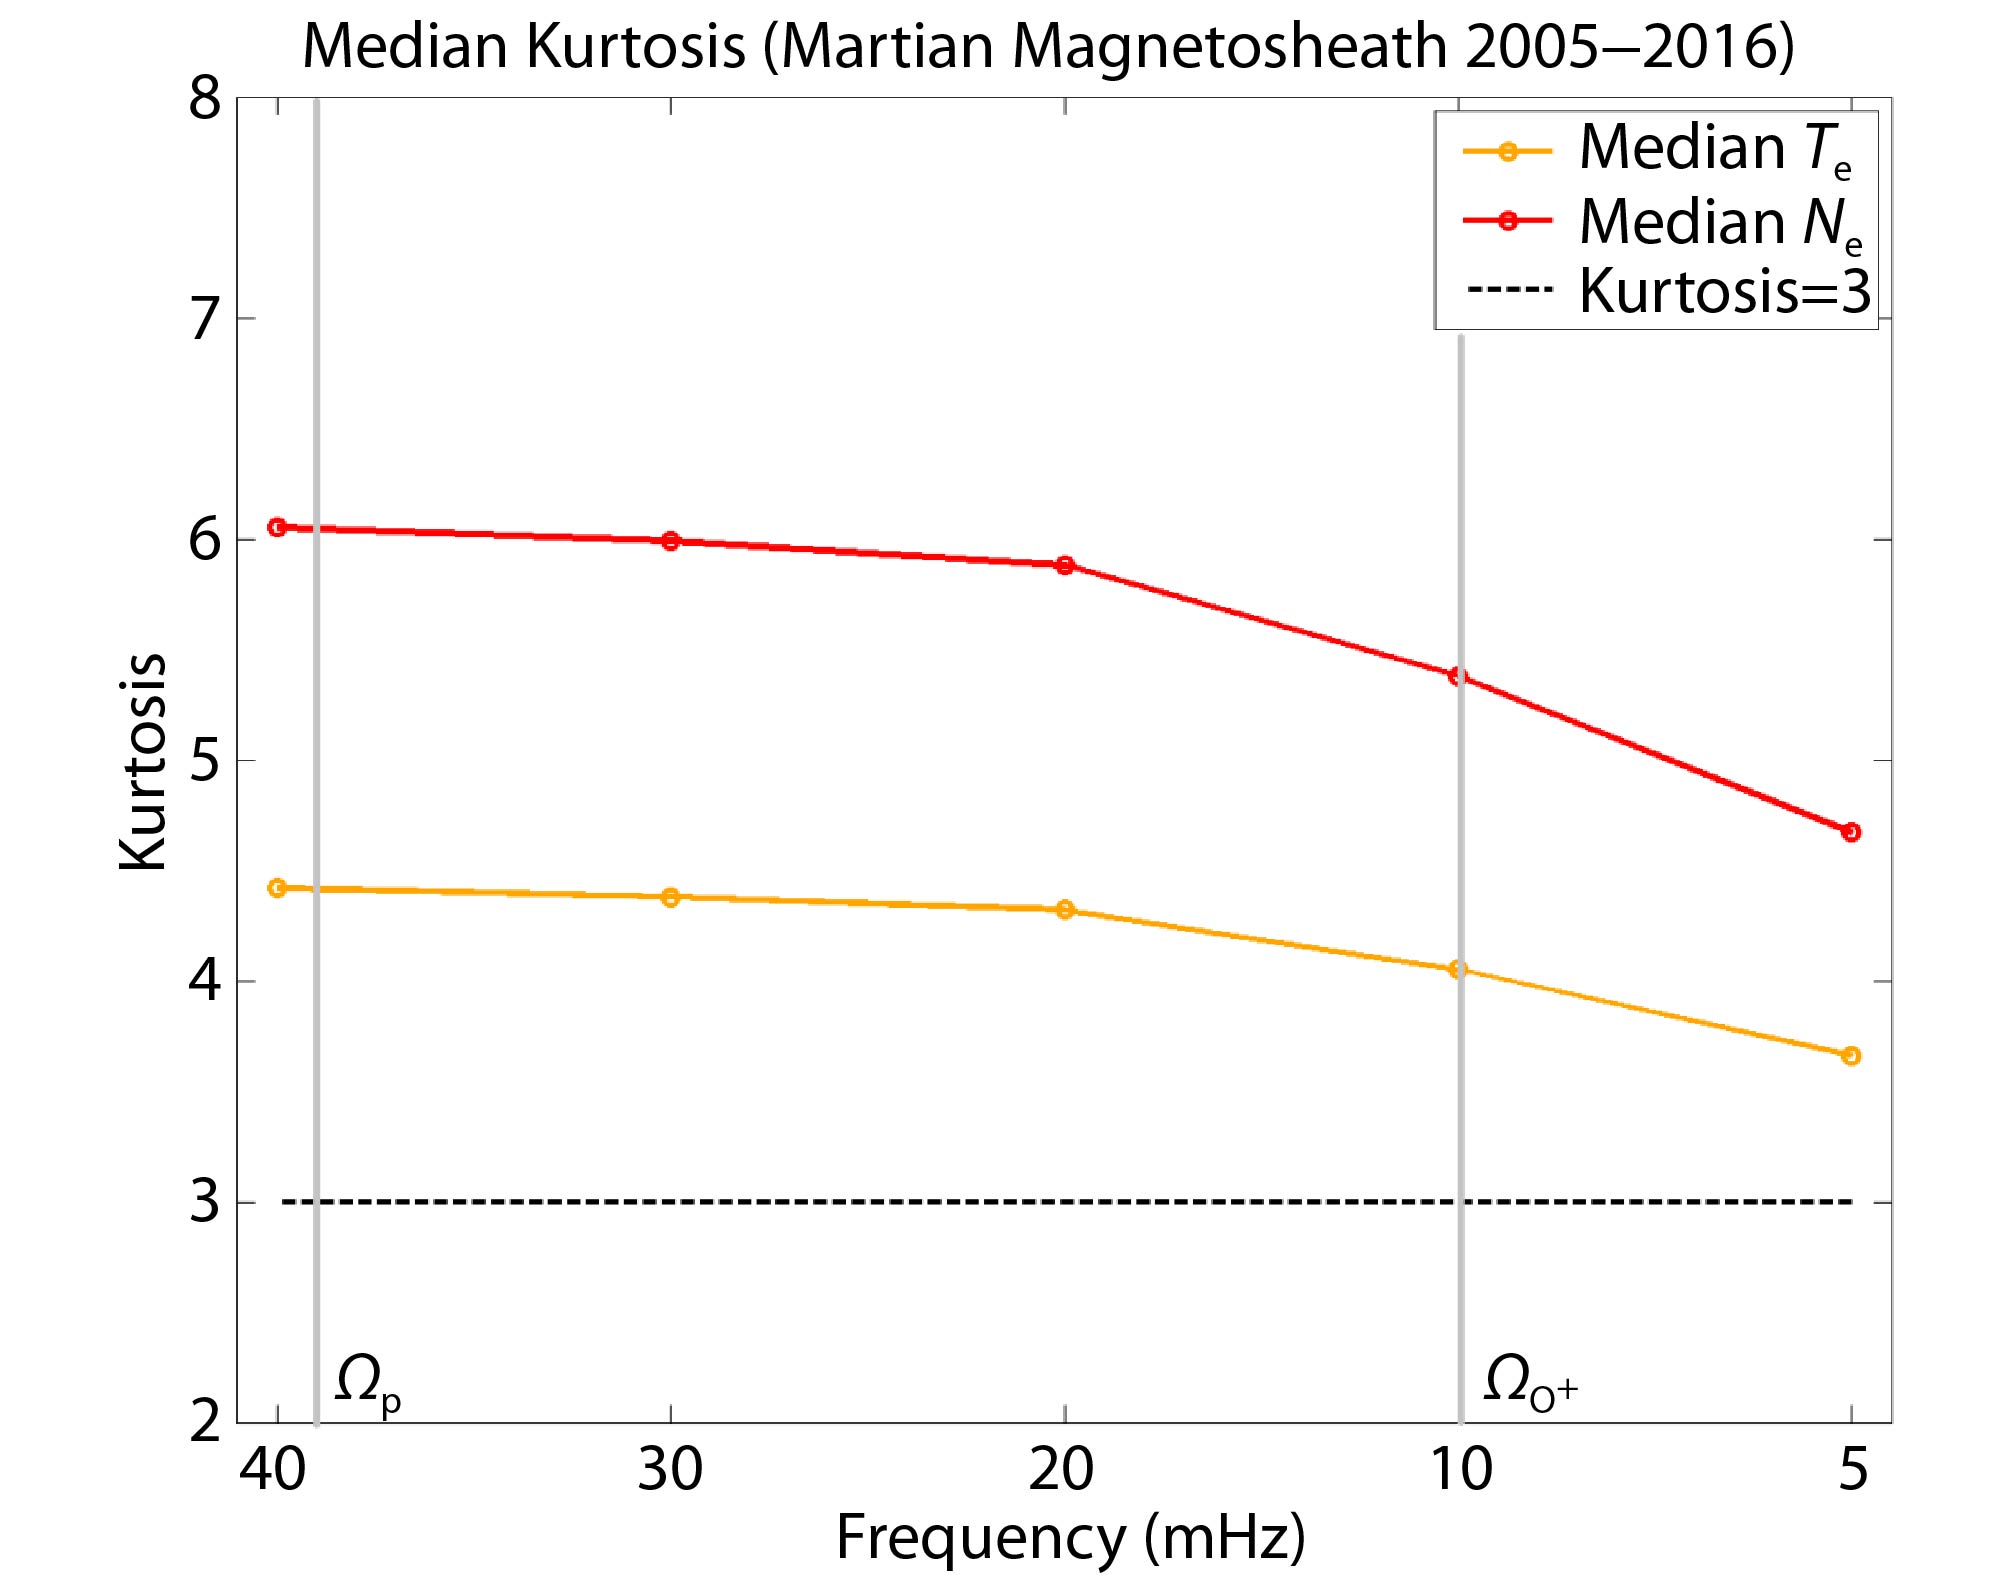
Median kurtosis parameters for electron temperature (orange) and electron density (red) are shown in Figure 3. In both variables the kurtosis shows a similar behavior: the electron density data presents higher values compared with electron temperature data. The kurtosis is higher than 3 (reference for a Gaussian distribution) in all scales. Further, it is possible to observe that the kurtosis is almost constant until the 20 mHz scale, then it decreases significantly with the decrease of frequency. This result means that intermittence phenomena seem to have higher occurrence at small scales. This pattern was also observed in a case study of the Jupiter magnetosheath using Ulysses data (Bolzan and Echer, 2014), and for the solar wind plasma radial variation in interplanetary space (Echer et al., 2020). Macek et al. (2018) have also observed that in the case of the Earth’s magnetosheath, turbulence at small scales is intermittent in the entire region, even near the magnetopause.
Figure
3.
Median kurtosis parameter for Ne (red line) and Te (orange line) data during intervals of MEX magnetosheath crossing between 2005 and 2016. The black dashed line represents a kurtosis value of 3. The vertical gray lines represent the proton gyrofrequency (Ωp) in the upstream region (39 mHz) found by Russell et al. (1990) and oxygen gyrofrequency (ΩO+) in the magnetosheath (10 mHz) found by Espley et al. (2004).
In the magnetosheath of Mars, the kurtosis for electron temperature data varies from values of 4.7 up to 6.1; for electron density it varies from values close to 4.4 down to less than 3.8 at the 5 mHz scale. Ruhunusiri et al. (2017) have also observed low negative values of spectral indices for the MHD range in the Martian magnetosheath, which indicates energy injection into the magnetosheath via multiple sources. Our results show that the kurtosis is higher in scales near the proton gyrofrequency (Ωp) found by Russell et al. (1990) using Phobos-2 data in the upstream region of the Martian magnetosphere (~39 mHz), agreeing with previous works that transient events from upstream of the bow shock can transfer energy to the inner magnetosphere (Collinson et al., 2018; Fowler et al., 2018). It is important to mention that the proton gyrofrequency varies with the magnetic field, which depends on solar wind conditions. Unfortunately, MEX does not carry a magnetometer, and thus we could not calculate the proton gyrofrequency using data for the interval analyzed in this work.
3.2
Solar Cycle Variation of Kurtosis
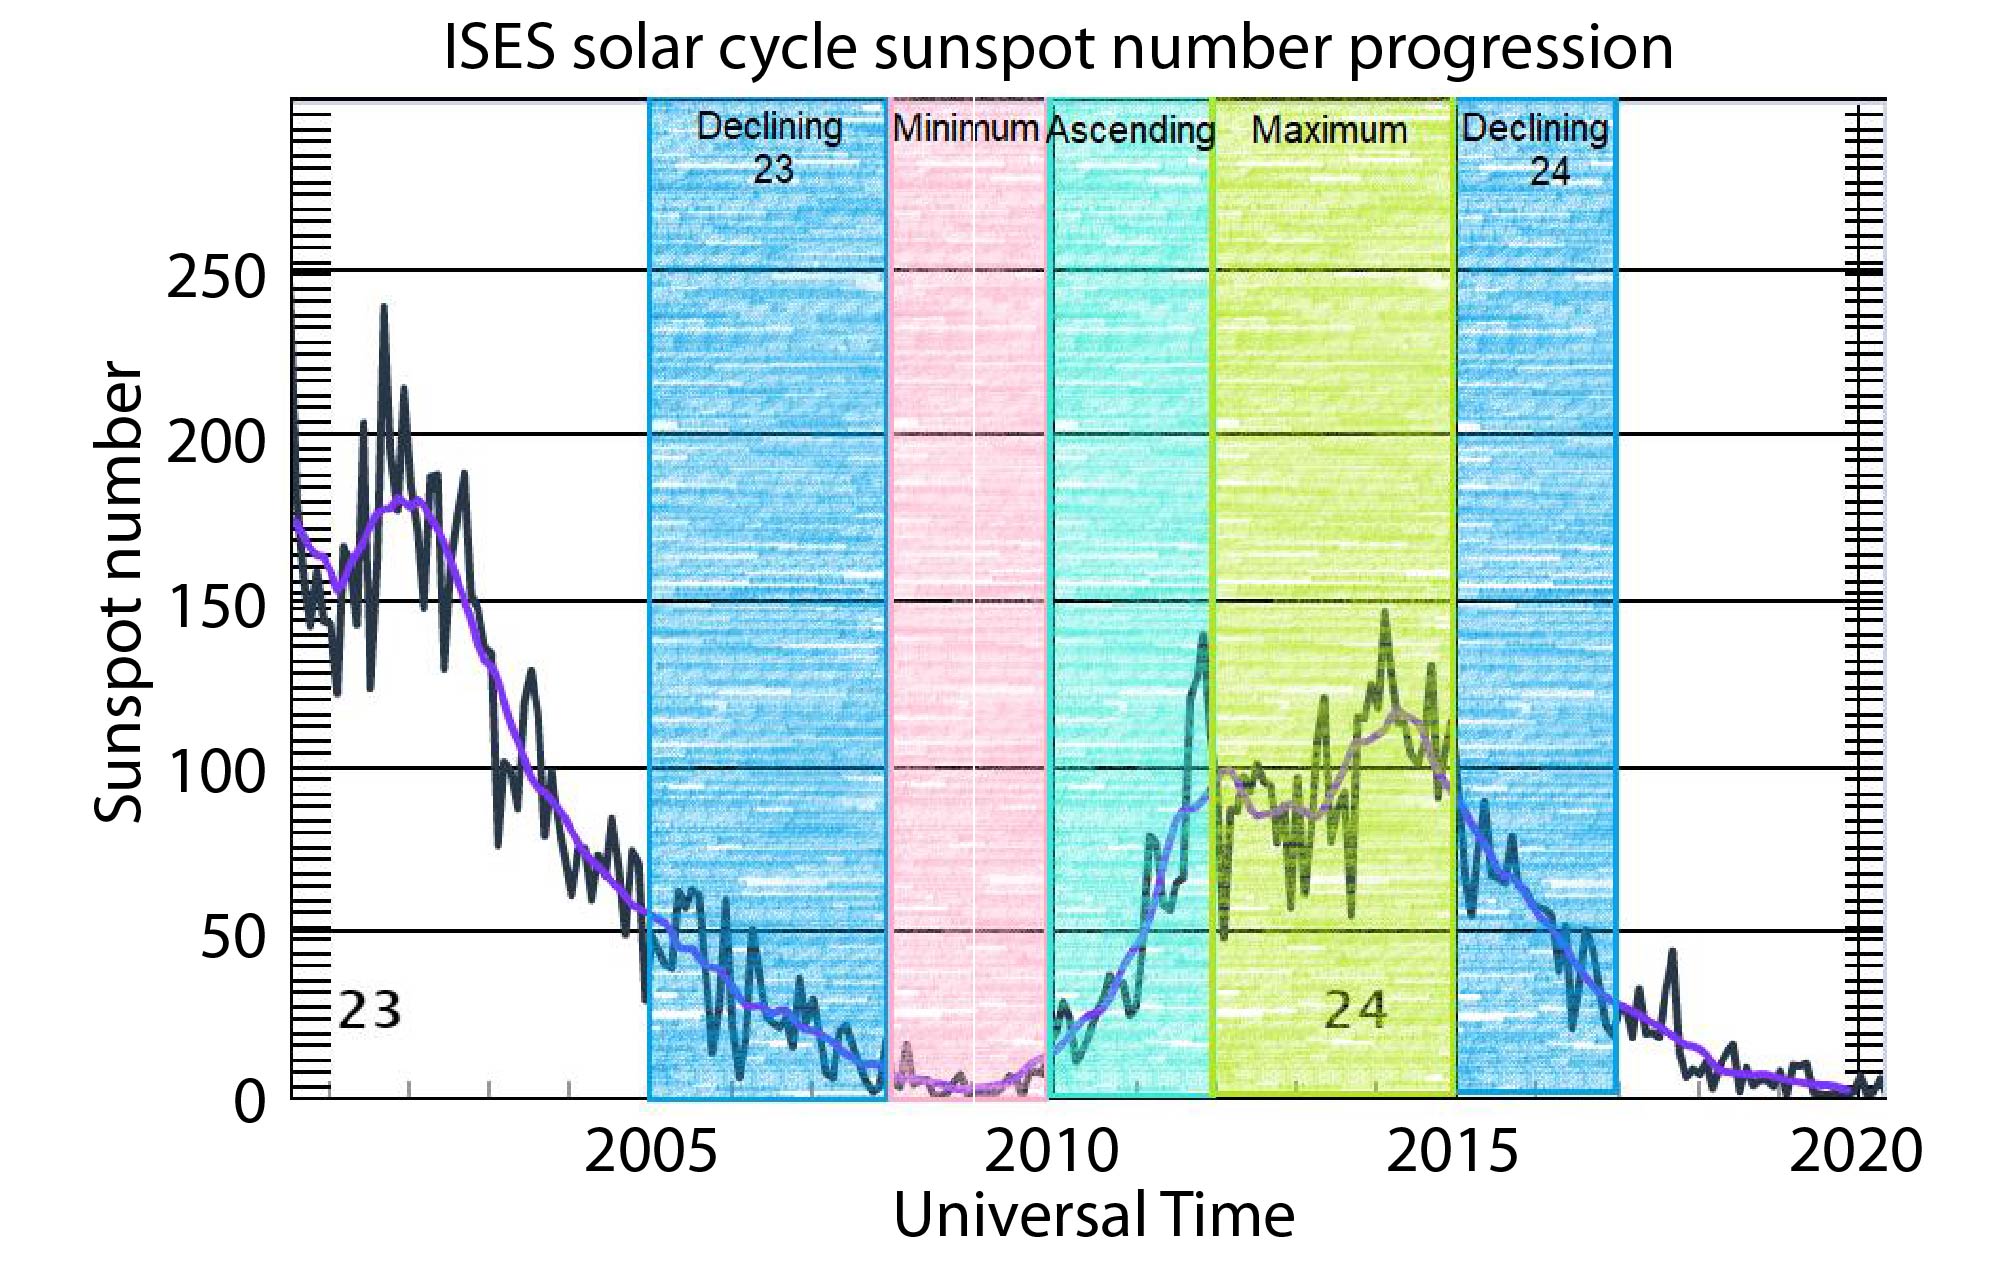
To investigate whether the solar cycle can influence the occurrence of wave activity in the magnetosheath of Mars, we have conducted the kurtosis analysis dividing the 12 years of MEX data used in this work into subsets according to solar cycle phase. The declining phases include 2005, 2006, 2007 (cycle 23) and 2015, 2016 (cycle 24). The minimum phase is considered between 2008 and 2009; the ascending phase, between 2010 and 2011; the maximum phase, from 2012 to 2014. Figure 4 presents sunspot number data for part of cycle 23 and for cycle 24. The solar cycle phases for the interval of the MEX mission studied here are marked in color: blue (declining), pink (minimum), cyan (ascending), and green (maximum).
Figure
4.
Sunspot numbers from 2001 to 2020. The solar cycle phases for the analyzed interval are marked in color: blue (declining), pink (minimum), cyan (ascending), and green (maximum).
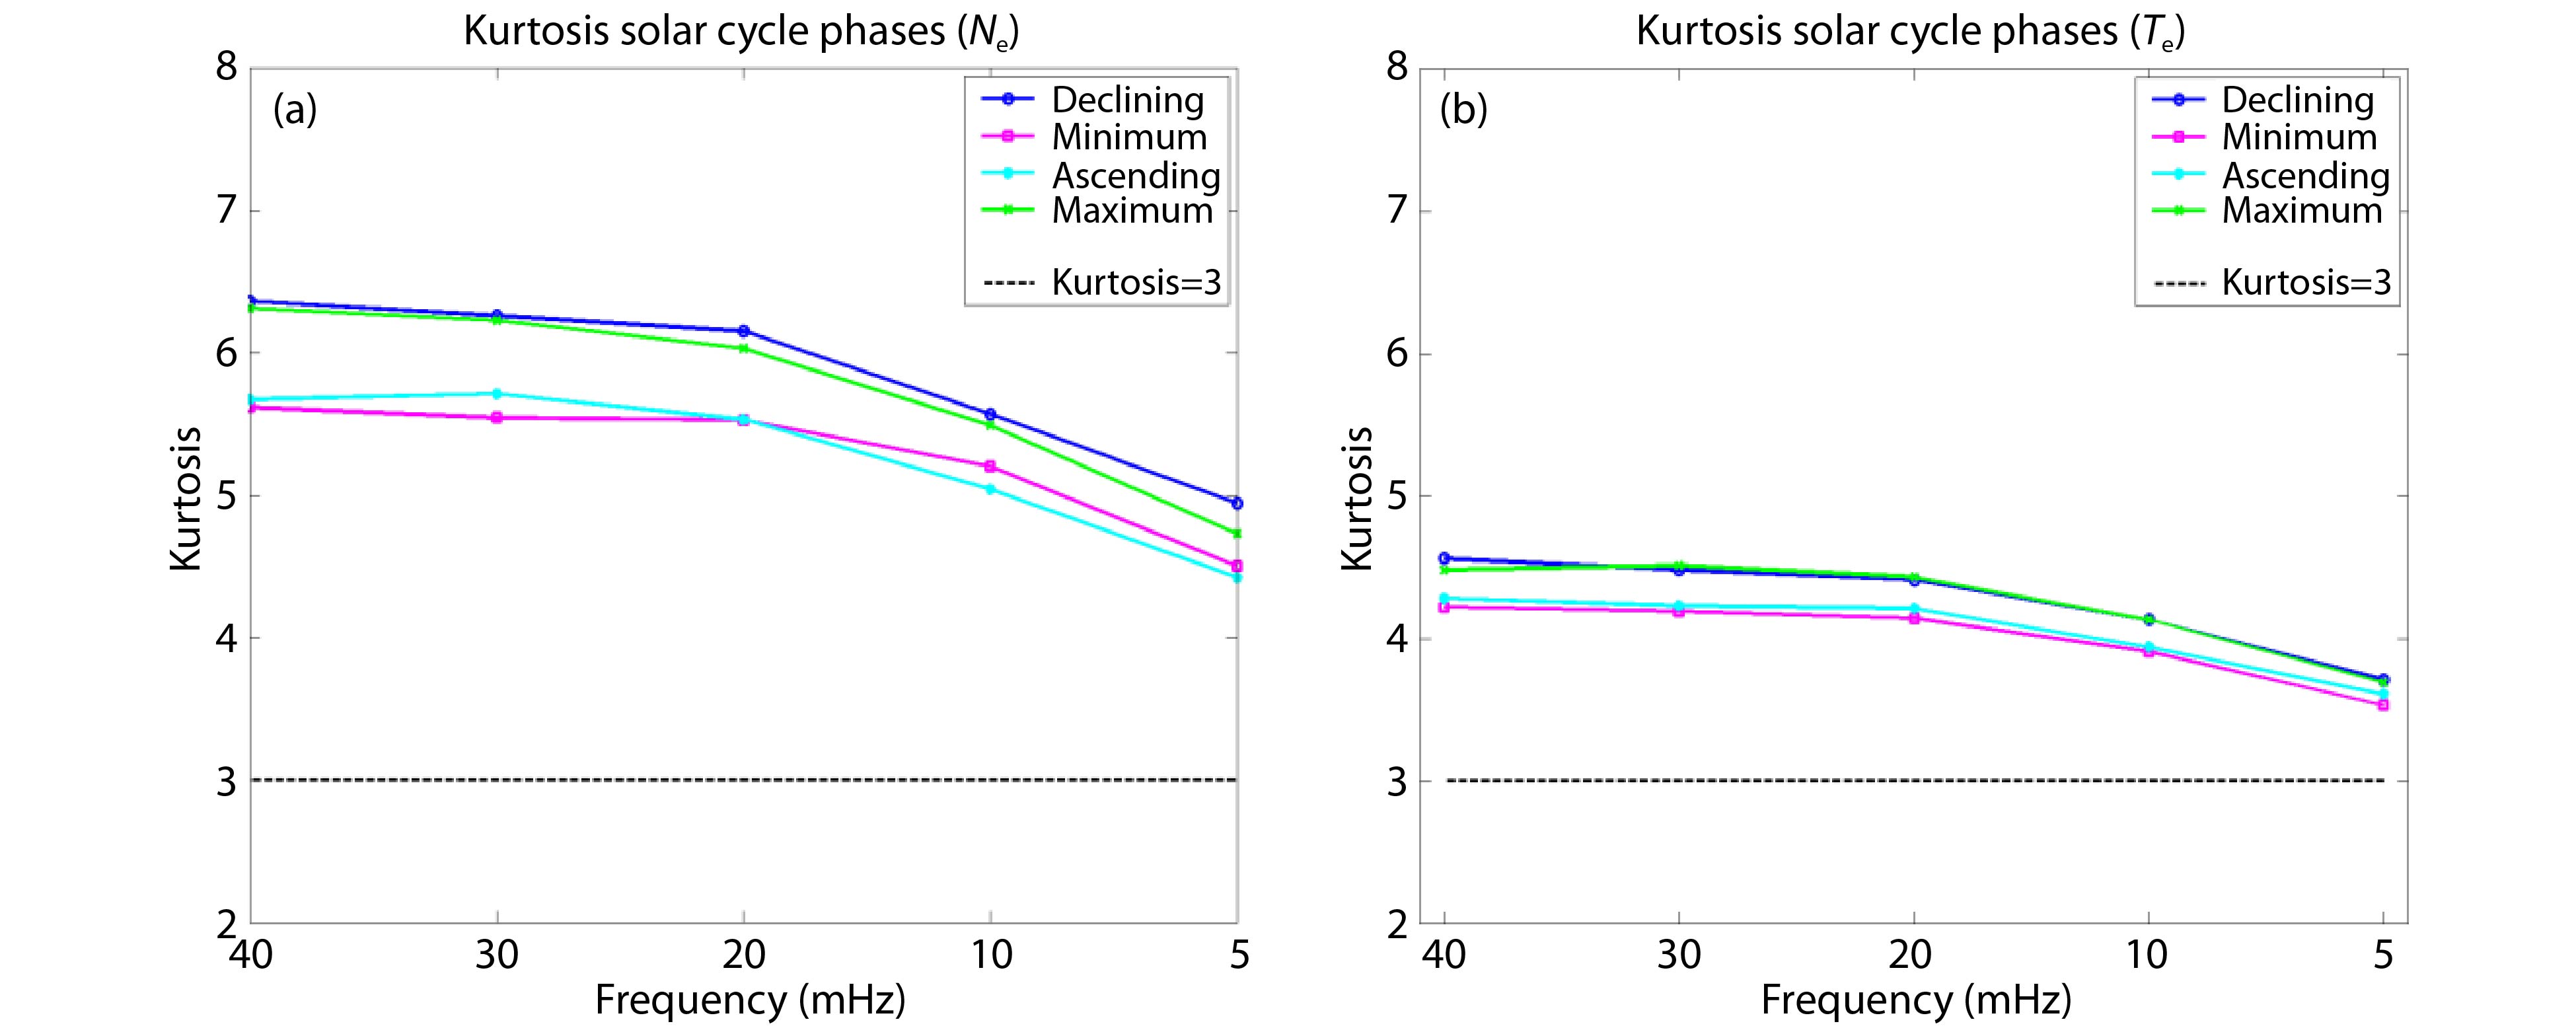
Figure 5 shows, for the four phases of the solar cycle, median kurtosis values for electron density (a) and temperature (b). In these figures we show declining phase in blue, minimum in magenta, ascending in cyan, and maximum in green.
Figure
5.
Median kurtosis parameter for Ne (a) and Te (b) data during intervals of MEX magnetosheath crossings divided into solar cycle phases. The dashed line represents the kurtosis parameter Equation (3).
Since intermittent behavior is a characteristic of solar wind parameters, and propagation of energy from upstream transient and local instabilities is always present in the Martian magnetosheath, kurtosis values higher than 3 are expected in all phases of the solar cycle, as is observed in Figure 5. Again, we can see that the kurtosis parameter is almost constant until 20 mHz and then decreases as the frequency decreases, evidencing that wave activity seems to be higher at small scales (higher frequencies). Lower kurtosis values are observed during the minimum and ascending phases; higher values, during the declining and maximum phases. These results indicate that fluctuations in the Martian magnetosheath are stronger in Ne and Te data at solar cycle declining and maximum phases. At the solar maximum, the coronal magnetic structure is highly variable and presents complex magnetic structures (Kiyani et al., 2007). As spatial intermittency is generally correlated with formation of coherent structures, a high kurtosis value observed during the solar maximum can be associated with the high occurrence then of interplanetary coronal mass ejections (ICME) and their respective solar wind shocks reaching the Martian orbit. An enhancement of intermittency in ICMEs has been observed in several previous studies (Kiyani et al., 2007; Bolzan and Rosa, 2012; Matthaeus et al., 2015).
Slow solar wind, with an average speed of ~400 km/s, is a high density solar wind flow, observed to be emitted from regions around the solar coronal streamer belt (Habbal et al., 1997; Schwenn, 2006). Fast solar wind, also called high speed stream (HSS) propagates from the coronal holes, with an average speed of ~700−800 km/s, and characterized by lower plasma densities and temperatures (Krieger et al., 1973; Bohlin, 1976; Sheeley et al., 1976). Marsch and Liu (1993) showed that slow solar wind is more intermittent than fast solar wind. During the solar minimum, the coronal magnetic structures are highly ordered, and fluctuations are dominated by turbulence of the interplanetary solar wind. The most magnetically ordered coronal region is located near the Sun's poles, and has been identified as the source of fast solar wind (Kiyani et al., 2007; Cranmer, 2009). Thus, the lower kurtosis values obtained in our analysis during solar minimum and ascending phases, compared with the other phases, can be explained by the higher occurrence of fast solar wind.
The interaction between HSS and slow solar wind generates corotating interaction regions (CIRs) in the solar wind with compressed plasma and magnetic field, high density, and strong fluctuations in the IMF (Balogh et al., 1999). During the declining phase, coronal holes start to migrate to the solar equator, which increases their effectiveness and the occurrence of CIRs. Then, in the declining phase of solar activity, we expect a mix of both phenomena; higher kurtosis values can be related to the high occurrence of both structures.
The ULF wave correlation length in the space environment of Mars was analyzed by de Souza Franco et al. (2019), using electron density data from MEX and electron density and magnetic field data from MAVEN. That study found that wave trains are larger during periods of high solar wind pressure than during periods of low pressure. The high pressure intervals correspond mainly to the presence of ICME and CIRs, which disturb the Martian environment.
Furthermore, the location of the Mars bow shock varies with solar EUV (Extreme Ultra Violet) and solar wind dynamic pressure. The bow shock moves inward when the pressure increases, and it moves outward with increasing EUV. These factors thus compete, sometimes enhancing and sometimes canceling each other (Russell et al., 1988; Hall et al., 2016). Hall et al. (2016) have shown that the EUV plays a larger role in the overall variations than the dynamic pressure. They have observed that the bow shock location increases on average by 7% between the solar maximum and its minimum. The EUV flux is higher during the maximum, which consequently increases the planetary ion production; the exosphere of the planet expands, which also enhances wave activity.
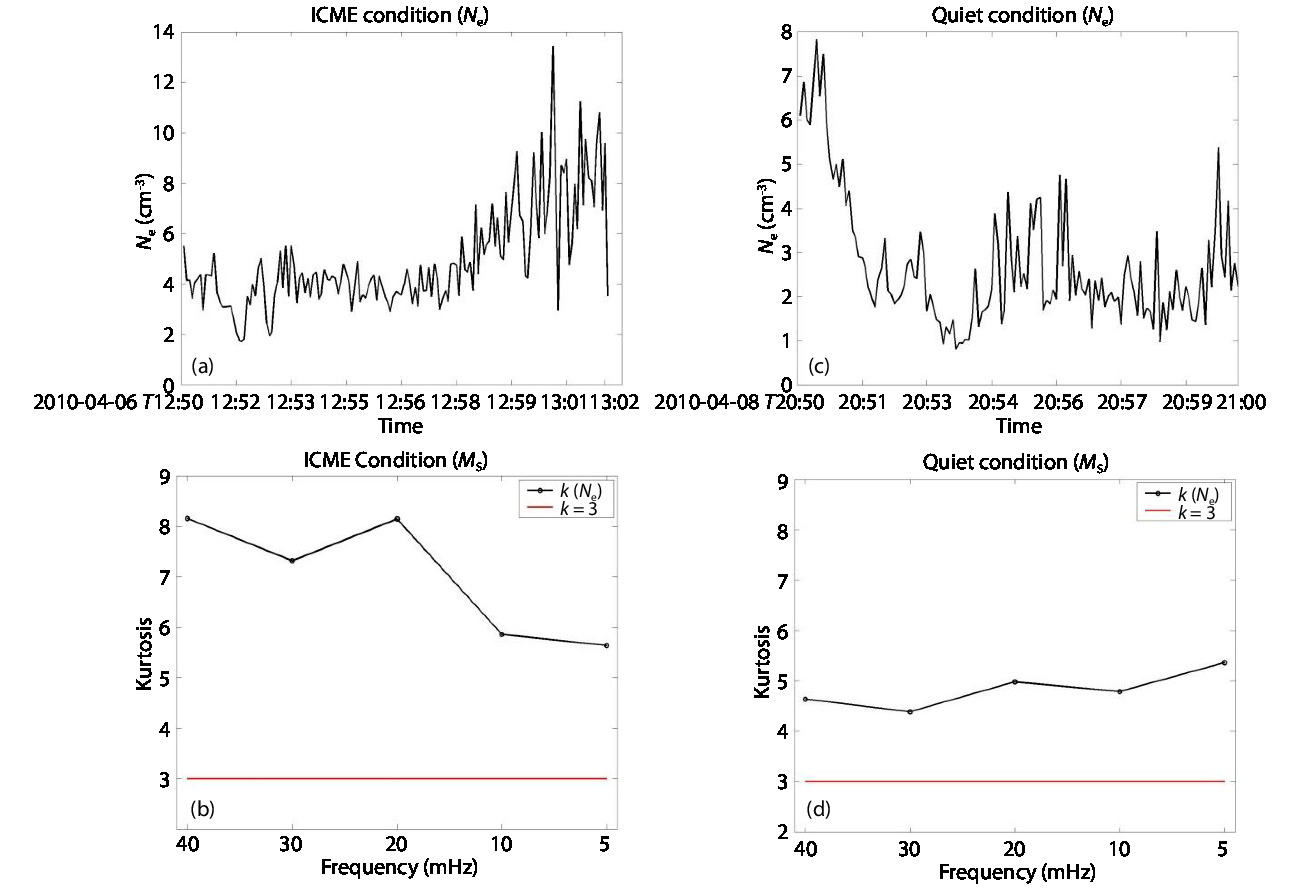
In order to support our result, we have also made direct comparison between magnetosheath kurtosis values during quiet solar wind conditions and ICME conditions. The ICME event used here was studied in detail by Opgenoorth et al. (2013) and Withers et al. (2016). In Figure 6, the time series of magnetosheath electron density data for intervals of ICME and quiet condition (Figure 6a and Figure 6c, respectively) can be observed. The ICME arrived at Mars on April 6, 2010; the magnetosheath observation interval corresponds to 12:50−13:02 UT of the same day. After the ICME, solar wind quiet condition was observed between April 8 and 10. The MEX magnetosheath crossing for quiet time used in this analysis occurred between 20:50 and 21:00 UT of April 8, 2010. From Figures 6b and 6d, one can note that the kurtosis (Ne data) for both solar wind conditions is higher than 3, emphasizing the presence of wave activity in the Martian magnetosheath; but as expected, the kurtosis is much higher for the interval of ICME condition. The kurtosis was also computed for Te data; the observed values were around three for both conditions, indicating that the effect is more significant in Ne data than in Te, as we observed in Figure 5.
Figure
6.Ne ASPERA-3/ELS time series for MEX magnetosheath crossing for an ICME condition (a) and a quiet condition (c). The kurtosis values computed for the ICME condition (b) and for the quiet condition (d) are shown on the lower panels in black lines. The red lines represent kurtosis value equal to 3.
These results show that wave activity in the magnetosheath of Mars is highly dependent on the solar cycle phase and disturbed solar wind conditions, especially when ICMEs and CIRs are passing by Mars; these interplanetary structures have been correlated with abrupt and large amplitude fluctuations in the Martian magnetosheath, which can transfer energy between scales within the Martian magnetospheric environment, including regions below the MPB, contributing to atmospheric loss.
3.3
Kurtosis Variation with the Martian Year
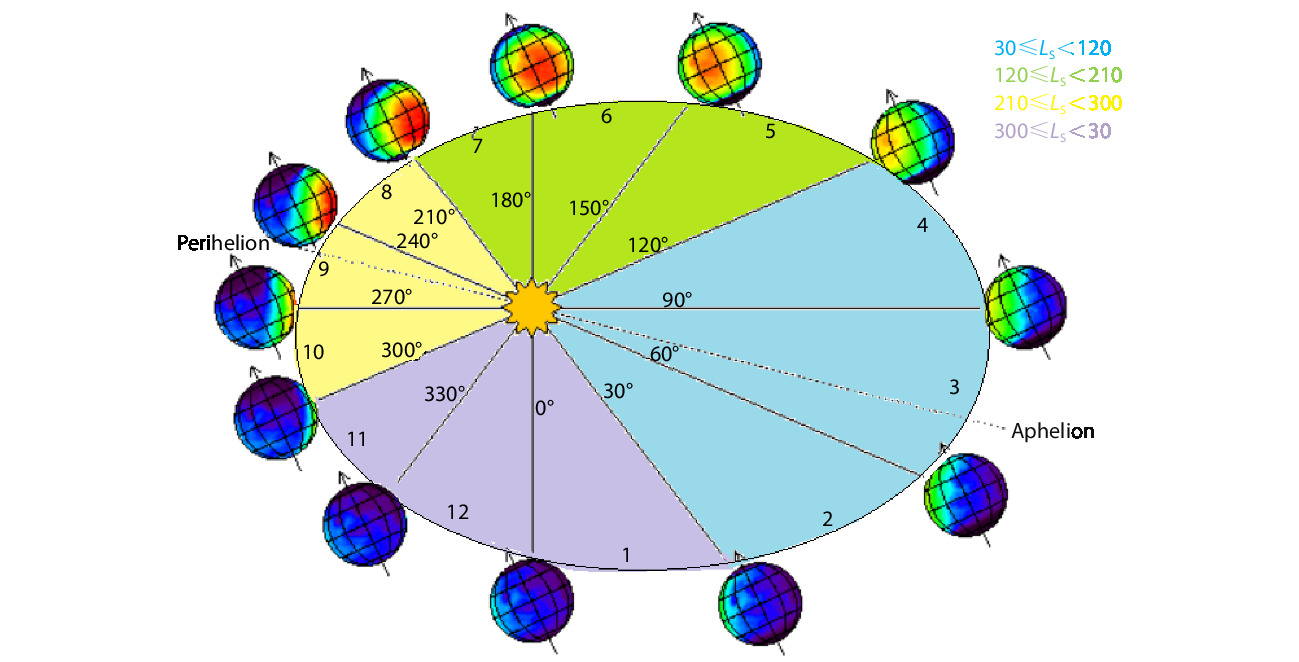
To investigate the dependence of the kurtosis parameter on the Martian orbit, we use plasma datasets classified into sub-intervals according to Martian solar longitude (LS) angle. The perihelion is located at LS=251∘ and aphelion at LS=71∘. The analysis was performed dividing the data interval into four LS ranges. Figure 7 shows the Martian orbit around the Sun and its solar longitude. Each sector of solar longitude range is represented by a color. The ranges are: 30≤LS<120 (cyan), 120≤LS<210 (green), 210≤LS<300 (yellow), and 300≤LS<30 (violet).
Figure
7.
Illustration of the Mars orbit and the solar longitude. Martian months are represented by sections of 30 degrees each, enumerated in the figure. The LS ranges used in our analysis are indicated by colors. Adapted from http://www-mars.lmd.jussieu.fr/mars/time/solar_longitude.html
The LS ranges were obtained by dividing the occurrence of the MEX magnetosheath crossings into the intervals between the LS limiting dates presented in Table1.
Table
1.
Solar longitude LS dates. Perihelion range (210≤LS<300), Aphelion range (30≤LS<120), Northern Hemisphere Autumn Equinox (120≤LS<210), and Northern Hemisphere Spring Equinox (300≤LS<30).
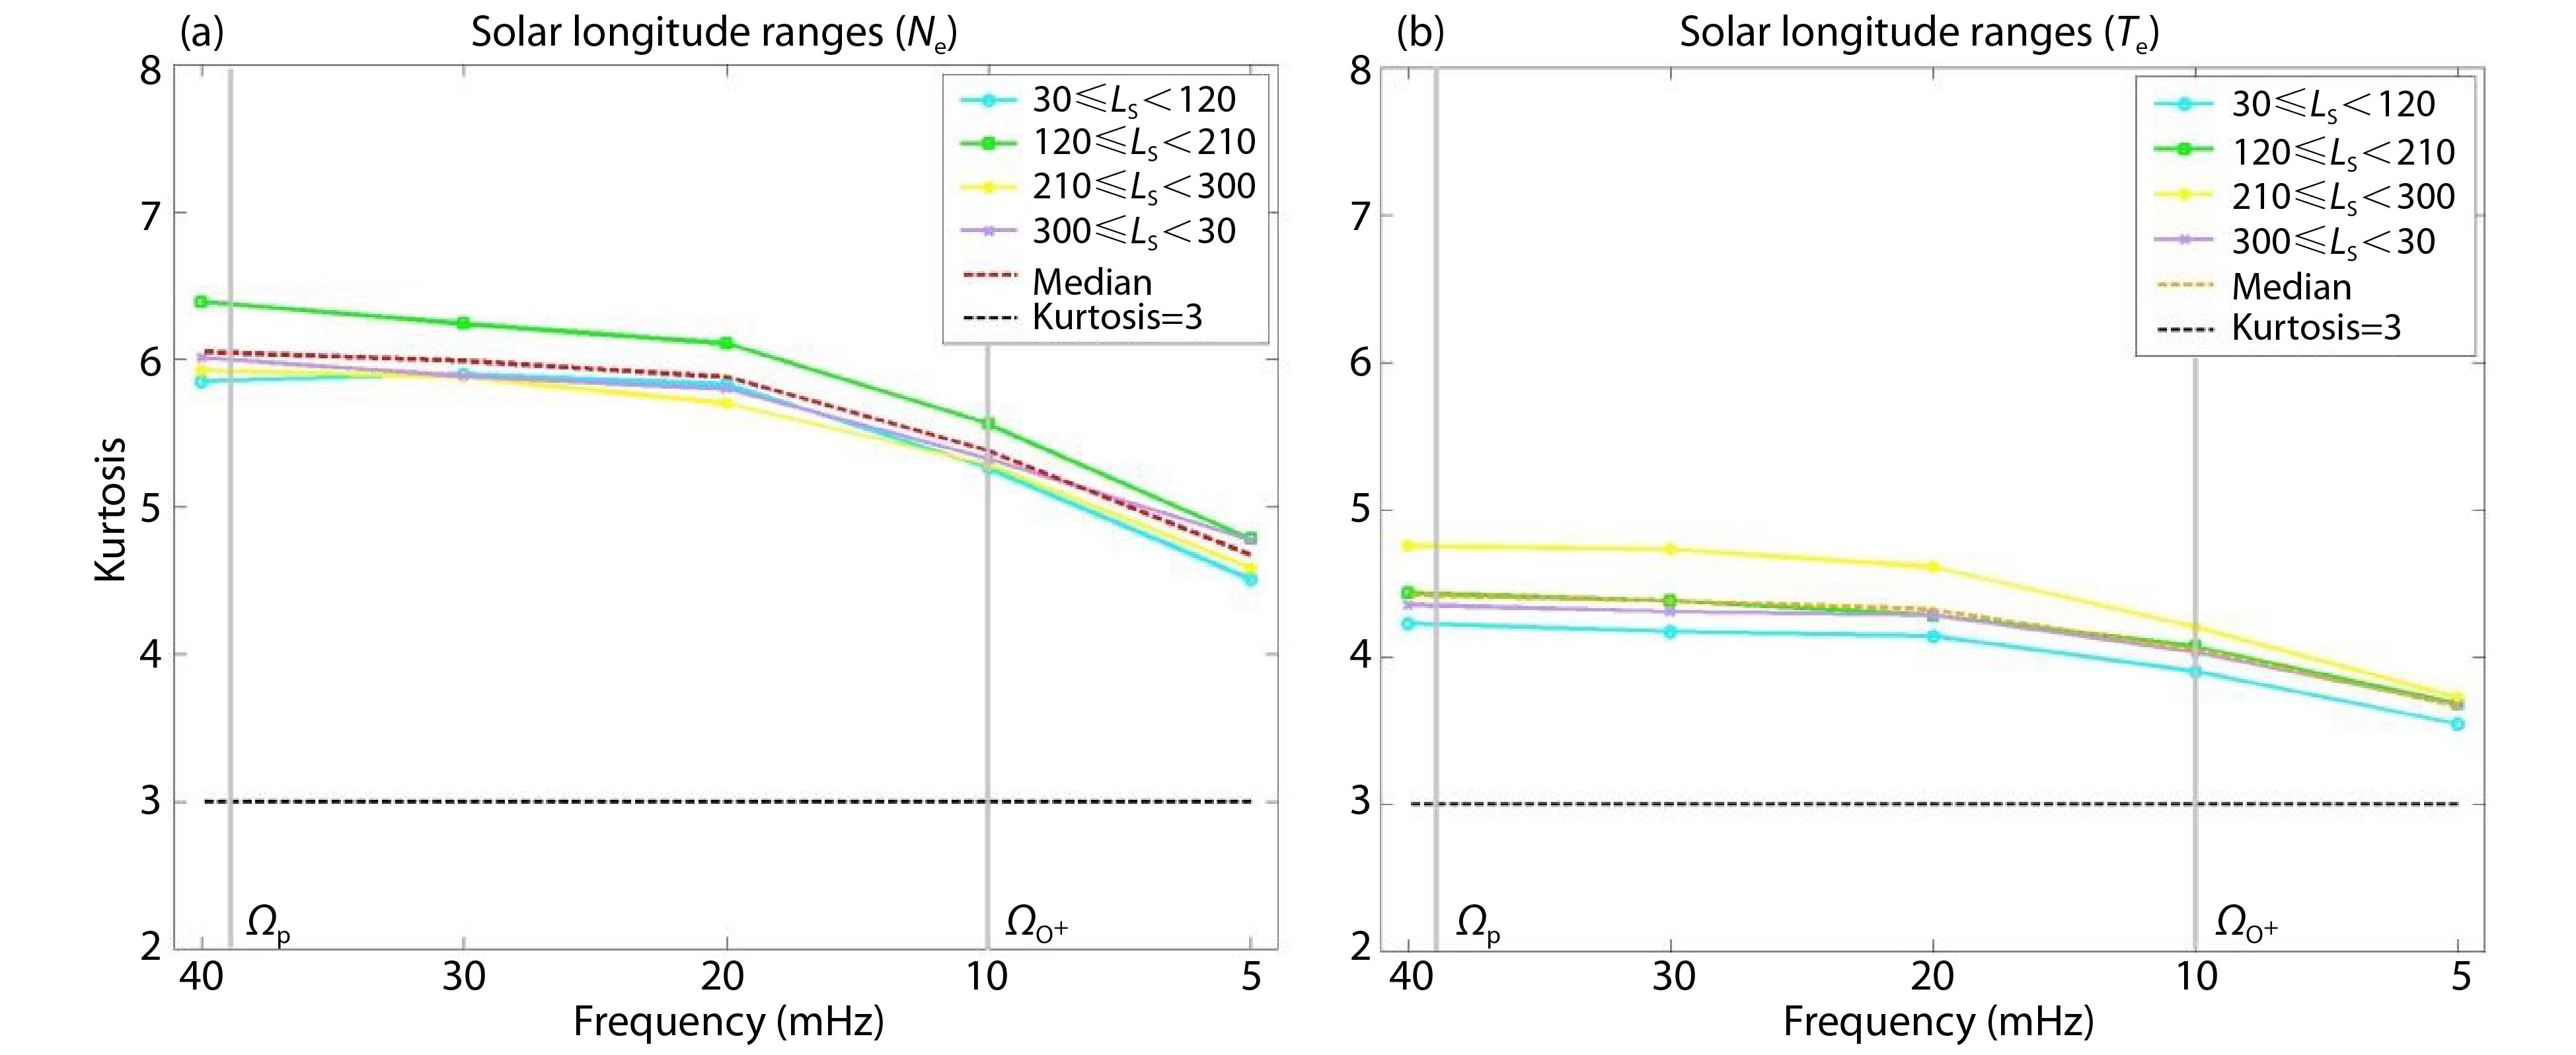
The exospheric density of a planet, as well as its ionospheric density, depends strongly on the solar EUV, once its upper atmosphere is ionized (mainly by EUV radiation and X-rays) (Luhmann et al., 1987; Shan LC et al., 2015; Ramstad et al., 2017). Since the EUV input into the Martian magnetosphere decreases with the Sun–Mars distance we expect that the solar longitude may also affect wave activity in the magnetosheath. Figure 8 shows the median kurtosis for Ne (Figure 8a) and Te (Figure 8a) in the four LS ranges. The median kurtosis for the entire analyzed interval is also presented in the figure. In this analysis, the kurtosis parameters still show the tendency of decrease from small scale (40 mHz) to large scales (5 mHz) in both variables. In order to explain these results we analyzed the electron temperature data first and then the electron density. From Figure 8b one can observe that the kurtosis is highest during the range 210≤LS<300, which corresponds to the interval that includes the perihelion. As Mars is closer to the sun, it receives more solar radiation around this interval. Halekas et al. (2017), using data from the EUVM (Extreme Ultraviolet Monitor) onboard MAVEN spacecraft, showed that the EUV flux in the Lyman-Alpha band varies from 0.0035−0.005 W/m² for a range including the perihelion (240≤LS<304) to 0.002−0.0035 W/m² for a range including the aphelion (8≤LS<131). The higher EUV flux during the range 210≤LS<300 results in an extended exosphere; consequently, planetary ions may intensify wave activity in the magnetosheath (Bertucci et al., 2013; Ruhunusiri et al., 2017).
Figure
8.
Median kurtosis parameter for Ne (a) and Te (b) data during intervals of MEX magnetosheath crossing divided into LS ranges. The dashed line represents the kurtosis parameter equal to 3. The median kurtosis for the entire data interval is also presented. The vertical gray lines represent the proton gyrofrequency (Ωp) in the upstream region (39 mHz) found by Russell et al. (1990) and oxygen gyrofrequency (ΩO+) in the magnetosheath (10 mHz) found by Espley et al. (2004).
The electron temperature result corroborates previous studies, which have concluded that newly born pickup ions from the extended exosphere and ions reflected from the bow shock (reflected exospheric pickup ions) contribute significantly to the generation of ULF waves, especially near the proton cyclotron frequency (Halekas et al., 2017; Ruhunusiri et al., 2017). Since both the proton cyclotron wave activity and the extension of the hydrogen exosphere vary with solar longitude, Halekas et al. (2017) suggest that the occurrence of upstream events can also show a seasonal variation (due to the changes in distance between Mars and the Sun). The electron temperature result shows that the kurtosis parameter is higher in the range 210≤LS<300 (including northern hemisphere winter solstice LS=270) and lower for the range 30≤LS<120 (northern hemisphere summer Solstice LS=90), which support that idea.
In the electron density data, Figure 8a, we report a different result: the range 120≤LS<210 (Northern Hemisphere Autumn Equinox) shows the higher kurtosis value; in the other three ranges the kurtosis is below the median kurtosis for the whole interval analyzed. In the upstream proton gyrofrequency, for the range that includes the perihelion, the kurtosis is higher than for the range that includes the aphelion, but in the 20 mHz scale the perihelion range shows a lower kurtosis value, when compared to the other ranges. In the 10 mHz scale, that corresponds to the oxygen ion gyrofrequency (ΩO+) in the Martian magnetosheath, calculated using data from the magnetometer from MGS (Espley et al., 2004). Thus, the kurtosis for the perihelion range turns out to be higher than in the aphelion range, probably due to the extended oxygen corona.
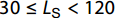
Besides the effect of the incident EUV flux variation during periods of perihelion to aphelion, the solar wind dynamic pressure also affects the Martian exosphere (Hall et al., 2016). The Martian bow shock forms closer to the planet during the perihelion than during the aphelion, and also during solar activity maximum periods (Hall et al., 2016, 2019). In order to refine our investigation, we have divided the data interval of the solar cycle phases into periods of aphelion and perihelion. The number of magnetosheath crossings for each phase/orbit position varies from 248 to 682 crossings. Figure 9 shows the kurtosis for the four phases of the solar cycle, divided into perihelion range (left panel) and aphelion range (right panel) for Ne (Figure 9a and 9b) and Te (Figure 9c and 9d). From the figure we can notice that, as expected, the kurtosis is higher in the perihelion phase during the maximum for both solar wind parameters, since we have the combination of high EUV flux and also high incidence of transient events. For the aphelion range, the kurtosis is highest for Ne in the declining phase, as was observed in the solar cycle analysis; for Te, kurtosis is very similar for all solar cycle phases.
Figure
9.
Kurtosis by solar cycle phase divided by aphelion and perihelion ranges.
Another result is that the kurtosis is higher during the aphelion range for Ne, different from what was expected and observed in the Te analysis. This difference agrees with our observation from the solar longitude analysis, which found that the Ne kurtosis seems to be higher during the aphelion than during the perihelion.
3.4
Kurtosis Dependence on Bow Shock Distance
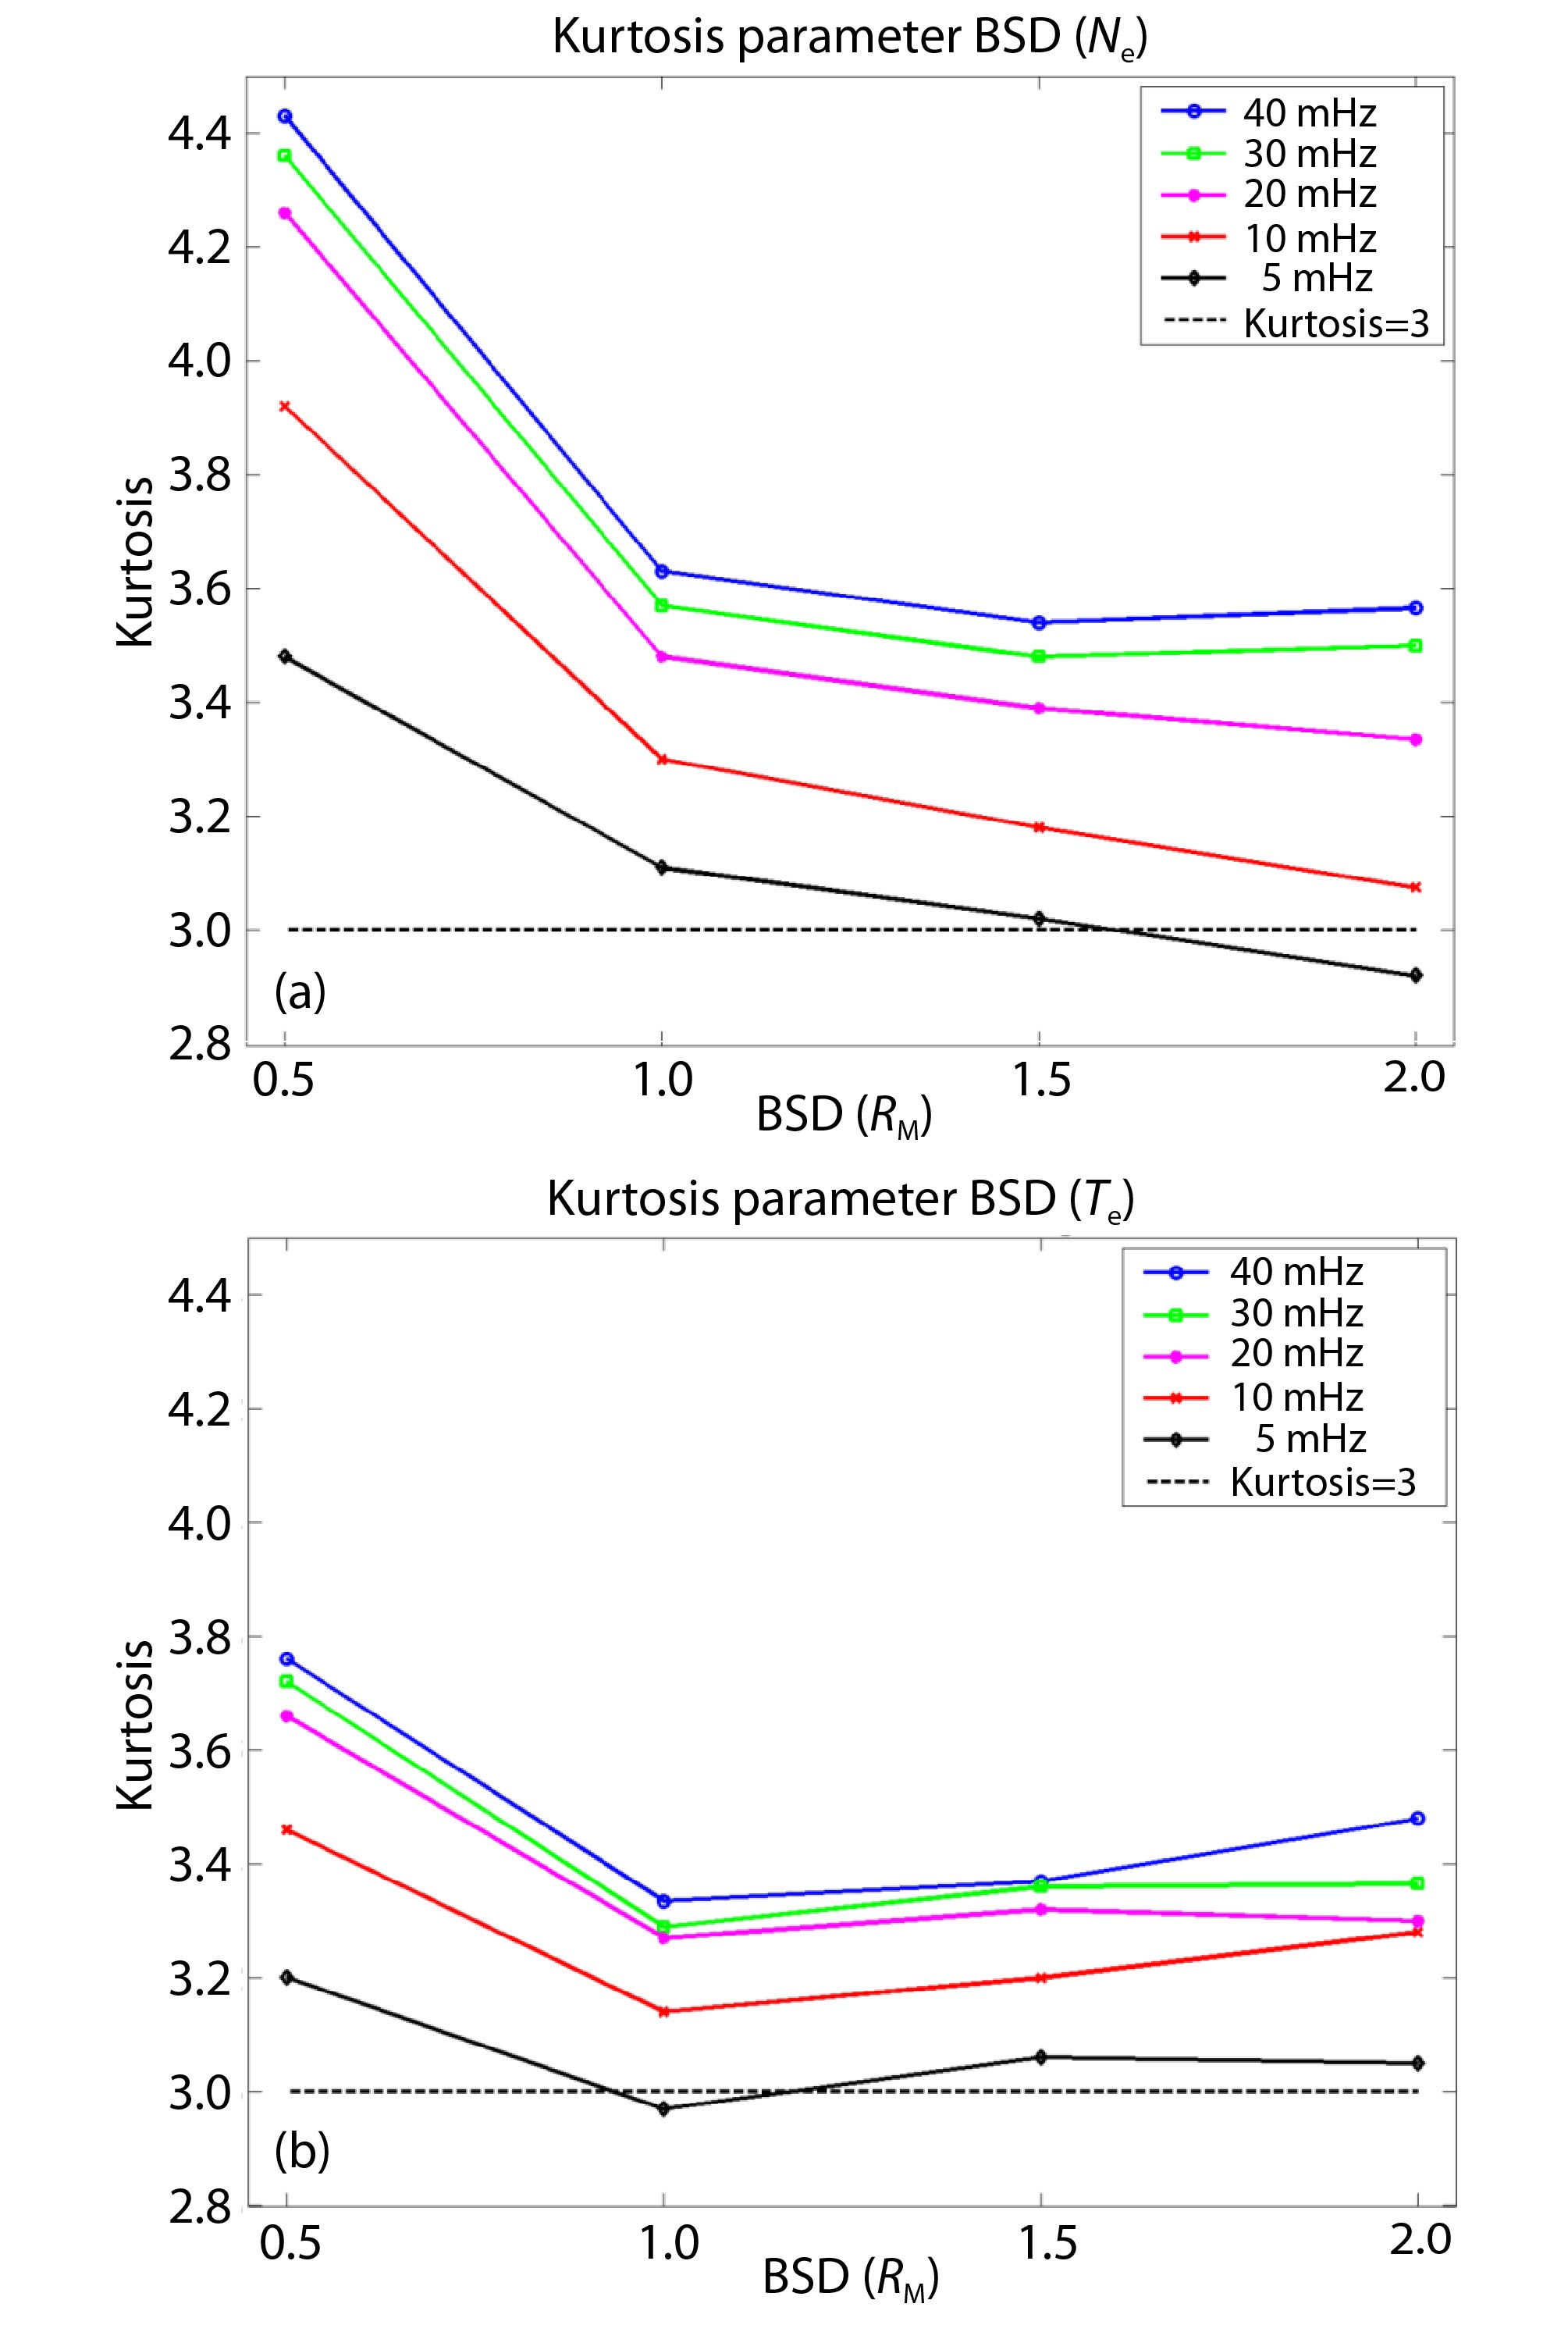
The kurtosis was also calculated for the following intervals of the bow shock distance (BSD) of the Martian system: 0>BSD≥0.5, 0.5>BSD≥1.0, 1.0>BSD≥1.5, and 1.5>BSD≥2.0, where BSD is defined as the distance in Martian radii of the spacecraft, measured along a normal on the nominal bow shock surface (positive inward). For these periods MEX is always in the magnetosheath. Figure 10a shows the results for Ne and Figure 10b shows the results for Te. The first observations for both variables are that the kurtosis decreases with BSD, indicating that it is higher near the bow shock than it is far away in the magnetosheath, especially in the first interval, 0>BSD≥0.5. Similar results were obtained by Ruhunusiri et al. (2017); they observed that the spectral index values observed in the magnetic field decrease when measured from the bow shock to the MPR. In fact, it is expected that the intermittence is higher near the bow shock due to the higher input of energy into the Martian system. The input of this energy promotes the Kolmogorovian cascades of energy dissipation, in which intermittence takes an important role (Frisch, 1995). Ruhunusiri et al. (2017) also observed the presence of fully developed energy cascades near the MPB, attributing them to energy injection occurring at frequencies below the proton gyrofrequency. These authors also affirm that energy cascades occur followed by particle heating, since boundary instabilities near the MPB are injecting energy, nourishing the plasma fluctuations.
Figure
10.
Kurtosis median value as a function of bow shock distance (going toward the MPB). (a) Ne. (b) Te. The dashed line represents the kurtosis equal to 3.
Another important point is that, although the kurtosis decreases from the bow shock toward the planet, a slight increase is observed in the kurtosis of the temperature data (Figure 10b) when the inner region of the magnetosheath is reached, where the extended exosphere of the planet should be denser. This increase of the kurtosis parameter is observed mainly at the scales of near upstream proton gyrofrequency and of the near local oxygen gyrofrequency. As this was observed earlier in the analysis depending on solar longitude, the effect of the extended corona seems to be significant for the temperature kurtosis.
We can observe other important results from the relationship between kurtosis and frequencies. The frequency scales are represented by color where 40 mHz is in blue, 30 mHz green, 20 mHz magenta, 10 mHz red, and 5 mHz black. As observed before, the low frequency wave data exhibit lower kurtosis values. We also observe that for the 5 mHz frequency in both variables the kurtosis reaches values below 3, in the range 1.5>BSD≥2.0 for Ne (Figure 10a) and in the range 1.0>BSD≥1.5 for Te (Figure 10b). These values can be related to the formation of large amplitude fluctuations and low frequency plasma oscillations near the MPB.
4.
Summary and Conclusion
In this work, electron density and temperature data observed during 12 years of MEX spacecraft travel have been analyzed statistically to characterize wave activity in the Martian magnetosheath.
A kurtosis parameter was determined for all electron density and temperature data from 9617 MEX magnetosheath crossings. Our results show that this parameter is typically higher than 3 (Gaussian distribution limit) in both variables (Ne and Te), but is higher in the electron density. This difference may reflect observational effects, since the ASPERA-3 electron sensor has only a narrow front of view (of 10° × 360°), which means that its observation makes a 2D cut through the 3D electron distribution. In such a situation the temperature can still be well determined while the density depends crucially on the angle between the bulk plasma speed and the sensor’s opening. Another possibility is that, in the case of compressive waves, initially the density is more affected because the compression will lead to a temperature increase only in a high density plasma, which could explain the higher value of kurtosis for electron density obtained in this work.
We find that the kurtosis value decreases from small scale (higher frequencies) to large scales (lower frequencies). We also observe that the kurtosis parameter is higher in the scales near the proton gyrofrequency in the upstream region, which emphasizes the influence of upstream events that can transfer energy to the inner magnetosphere.
A significant solar cycle phase dependence was observed: data kurtosis is higher in the declining and maximum phases. This we believe to be due to the frequent occurrence of large scale structures in the solar wind, such as CIRs and ICMEs. Different results were obtained between Ne and Te data in the analysis of dependence on solar longitude. In the Ne data, the kurtosis is higher in the 120≤LS<210 range, which includes the Northern Hemisphere Autumn Equinox. For Te, higher values of kurtosis were observed in the range that includes the perihelion, and lower values in the aphelion range. This difference may be caused by the higher incidence of EUV when the planet is closer to the Sun, at which time the exosphere is extended, increasing wave activity in the magnetosheath and upstream region.
We have also observed that, for both variables, the kurtosis decreases with increasing distance from the bow shock, indicating that fluctuations are higher near the bow shock. A slight increase of the kurtosis in the temperature data near the MPB was noticed, where the exosphere is denser. As was observed in the analysis of dependence on solar longitude, the effect of the extended exosphere seems to be more significant for the electron temperature.
Temperature can be interpreted as indicative of the energy of the plasma; density is indicative of total plasma mass or number of particles. It seems that plasma energy fluctuations are more intermittent close to the bow shock and in periods of higher EUV and higher solar wind pressure. The situation for total plasma density, however, is more difficult to interpret. A higher incidence of EUV does not seem to have a clear effect on plasma density intermittence. One possible explanation is that the bow shock distance is larger at times of higher EUV incidence, which means a bow shock with a different Mach number, leading to a more variable heating; density would be less affected.
In Table 2 we present all the kurtosis values that were found in our results for Ne and Te .
Table
2.
Kurtosis values for Ne and Te data at all scales.
In Table 3 we summarize the main results that were found in this work, where the scale/range with higher kurtosis parameter for each analysis (whole interval, solar cycle, Martian orbit, and bow shock) is presented. The possible causes of kurtosis differences are also shown in the table.
Table
3.
Higher kurtosis parameter scale/range and their possible causes.
Ne
Te
Higher kurtosis parameter scale/range
Possible cause
Higher kurtosis parameter scale/range
Possible cause
Fluctuation scale (whole interval)
40 mHz
Near the proton gyrofrequency in the upstream region. Upstream events can transfer energy to the inner magnetosphere.
40 mHz
Near the proton gyrofrequency in the upstream region. Upstream events can transfer energy to the inner magnetosphere.
Solar cycle phase
Declining/ Maximum
Frequent occurrence of large scale structures in the solar wind (CIRs and ICMEs).
Declining/ Maximum
Frequent occurrence of large scale structures in the solar wind (CIRs and ICMEs).
Martian orbit
120≤LS<210
unknown/not clear
210≤LS<300
proton cyclotron wave activity and the extension of the hydrogen exosphere.
Bow shock distance
0>BSD≥0.5
Higher input of energy into the Martian system, which promotes the Kolmogorovian cascades of energy dissipation.
0>BSD≥0.5
Higher input of energy into the Martian system, which promotes the Kolmogorovian cascades of energy dissipation.
Other factors can also affect wave activity in the Martian magnetosheath, such as solar zenith angle and IMF orientation. At the subsolar point, the magnetosheath is more compressed; we would thus expect that the kurtosis would be higher than at the terminators, since we have more intense wave activity in this region. However, during orbits in which the spacecraft crossed the terminator region, the interval that it remained in the magnetosheath was larger than when its orbit took it to the sub solar point, and more turbulence can be observed in the data. Furthermore, the kurtosis should be higher for quasi-perpendicular conditions, since the most turbulent magnetosheath is found below quasi-perpendicular shocks.
In conclusion, we report that kurtosis parameters for temperature and density data are higher than 3 in the magnetosheath of Mars, and reflect a significant dependence on the solar cycle as well as on the distance of the bow shock. A difference between kurtosis values for these two variables in data from the extended exosphere was observed; this difference should be explored in future works.
Acknowledgments
A.M.S.F thanks FAPESP for PhD fellowship support (projects 2016/10794-2 and 2017/00516-8) and the CNPq agency (projects PQ-300969/2020-1, PQ-301542/2021-0) for their support. EE would like to thank the Brazilian FAPESP (2018/21657-1) and CNPq (PQ-301883/2019-0) agencies for financial support. M. J. A. Bolzan was supported by CNPq agency contract number (PQ-305692/2018-6) and FAPEG agency contract number 2012.1026.7000905. The processing of Mars Express electron data was supported by German Space Agency grant 50QM1703.
Acuña, M. H., Connerney, J. E. P., Wasilewski, P., Lin, R. P., Anderson, K. A., Carlson, C. W., Mcfadden, J., Curtis, D. W., Mitchell, D., … Ness, N. F. (1998). Magnetic field and plasma observations at Mars: initial results of the Mars Global Surveyor Mission. Science, 279(5357), 1676–1680. https://doi.org/10.1126/science.279.5357.1676
Andrés, N., Romanelli, N., Hadid, L. Z., Sahraoui, F., DiBraccio, G., and Halekas, J. (2020). Solar wind turbulence around Mars: Relation between the energy cascade Rate and the Proton Cyclotron Waves Activity. Astrophys. J., 902(2), 134. https://doi.org/10.3847/1538-4357/abb5a7
Balogh, A., Bothmer, V., Crooker, N. U., Forsyth, R. J., Gloeckler, G., Hewish, A., Hilchenbach, M., Kallenbach, R., Klecker, B., … Mikić, Z. (1999). The solar origin of corotating interaction regions and their formation in the inner heliosphere. Space Sci. Rev., 89, 141–178. https://doi.org/10.1023/A:1005245306874
Banerjee, S., Hadid, L. Z., Sahraoui, F., and Galtier, S. (2016). Scaling of compressible magnetohydrodynamic turbulence in the fast solar wind. Astrophys. J. Lett., 829(2), L27. https://doi.org/10.3847/2041-8205/829/2/L27
Barabash, S. , Lundin, R. , Andersson, H. , Gimholt, J. , Holmström, M. , Norberg, O. , Yamauchi, M. , Asamura, K. , Coates, A. J. , … Bochsler, P. (2004). ASPERA-3: Analyser of space plasmas and energetic ions for mars express. In A. Wilson (Ed. ), Mars Express: The Scientific Payload (pp. 121-139). Noordwijk, Netherlands: ESA Publications Division.
Barabash, S., Lundin, R., Andersson, H., Brinkfeldt, K., Grigoriev, A., Gunell, H., Holmström, M., Yamauchi, M., Asamura, K., … Thocaven, J. J. (2006). The analyzer of space plasmas and energetic atoms (ASPERA-3) for the Mars express mission. Space Sci. Rev., 126, 113–164. https://doi.org/10.1007/s11214-006-9124-8
Bertucci, C., Romanelli, N., Chaufray, J. Y., Gomez, D., Mazelle, C., Delva, M., Modolo, R., González-Galindo, F., and Brain, D. A. (2013). Temporal variability of waves at the proton cyclotron frequency upstream from Mars: Implications for Mars distant hydrogen exosphere. Geophys. Res. Lett., 40(15), 3809–3813. https://doi.org/10.1002/grl.50709
Bohlin, J. D. (1976). The physical properties of coronal holes. In Physics of Solar Planetary Environments: Proceedings of the International Symposium on Solar-Terrestrial Physics (pp. 114-128). Boulder, Colorado: American Geophysical Union.
Bolzan, M. J. A., Ramos, F. M., Sá, L. D. A., Neto, C. R., and Rosa, R. R. (2002). Analysis of fine-scale canopy turbulence within and above an Amazon forest using Tsallis' generalized thermostatistics. J. Geophys. Res., 107(D20), 8063. https://doi.org/10.1029/2001JD000378
Bolzan, M. J. A., and Rosa, R. R. (2012). Multifractal analysis of interplanetary magnetic field obtained during CME events. Ann. Geophys., 30(8), 1107–1112. https://doi.org/10.5194/angeo-30-1107-2012
Bolzan, M. J. A., and Echer, E. (2014). A multifractal approach applied to the magnetic field turbulence in Jupiter's magnetosheath. Planet. Space Sci., 91, 77–82. https://doi.org/10.1016/j.pss.2013.12.004
Bolzan, M. J. A. (2018). A modeling substorm dynamics of the magnetosphere using self-organized criticality approach. Physica A:Statist. Mech. Appl., 503, 1182–1188. https://doi.org/10.1016/j.physa.2018.08.157
Bruno, R., Carbone, V., Bavassano, B., and Sorriso-Valvo, L. (2005). Observations of magnetohydrodynamic turbulence in the 3D heliosphere. Adv. Space Res., 35(5), 939–950. https://doi.org/10.1016/j.asr.2005.01.106
Bruno, R., and Carbone, V. (2013). The solar wind as a turbulence laboratory. Living Rev. Sol. Phys., 10, 2. https://doi.org/10.12942/lrsp-2013-2
Chasapis, A., Matthaeus, W. H., Parashar, T. N., Lecontel, O., Retinò, A., Breuillard, H., Khotyaintsev, Y., Vaivads, A., Lavraud, B., … Saito, Y. (2017). Electron heating at kinetic scales in magnetosheath turbulence. Astrophys. J., 836(2), 247. https://doi.org/10.3847/1538-4357/836/2/247
Chhiber, R., Chasapis, A., Bandyopadhyay, R., Parashar, T. N., Matthaeus, W. H., Maruca, B. A., Moore, T. E., Burch, J. L., Torbert, R. B., … Gershman, D. J. (2018). Higher-order turbulence statistics in the Earth’s magnetosheath and the solar wind using Magnetospheric Multiscale observations. J. Geophys. Res. :Space Phys., 123(12), 9941–9954. https://doi.org/10.1029/2018JA025768
Chicarro, A. , Martin, P. , and Trautner, R. (2004). The Mars Express Mission: an overview. In A. Wilson (Ed. ), Mars Express: The Scientific Payload (pp. 3-16). Noordwijk, Netherlands: ESA Publications Division.
Collinson, G., Wilson, L. B. Iii, Omidi, N., Sibeck, D., Espley, J., Fowler, C. M., Mitchell, D., Grebowsky, J., Mazelle, C., … Jakosky, B. (2018). Solar wind induced waves in the skies of Mars: Ionospheric compression, energization, and escape resulting from the impact of ultralow frequency magnetosonic waves generated upstream of the Martian bow shock. J. Geophys. Res. :Space Phys., 123(9), 7241–7256. https://doi.org/10.1029/2018JA025414
Cravens, T. E. (1997). Physics of Solar System Plasmas (pp. 343-356). Cambridge: Cambridge University Press.
de Souza Franco, A. M. (2018). A Study of Plasma Waves in the Induced Magnetospheres of Mars and Venus. São José dos Campos, Brazil: National Institute for Space Research.
de Souza Franco, A. M., Fränz, M., Echer, E., and Bolzan, M. J. A. (2019). Correlation length around Mars: A statistical study with MEX and MAVEN observations. Earth Planet. Phys., 3(6), 560–569. https://doi.org/10.26464/epp2019051
Dwivedi, N. K., Kumar, S., Kovacs, P., Yordanova, E., Echim, M., Sharma, R. P., Khodachenko, M. L., and Sasunov, Y. (2019). Implication of kinetic Alfvén waves to magnetic field turbulence spectra: Earth’s magnetosheath. Astrophys. Space Sci., 364(6), 101. https://doi.org/10.1007/s10509-019-3592-2
Echer, E., Gonzalez, W. D., Guarnieri, F. L., Dal Lago, A., and Vieira, L. E. A. (2005). Introduction to space weather. Adv. Space Res., 35(5), 855–865. https://doi.org/10.1016/j.asr.2005.02.098
Echer, E., Bolzan, M. J. A. (2016). A comparative study of solar wind and foreshock turbulence near Uranus orbit. Planetary and Space Science, 120, 70–77. https://doi.org/10.1016/j.pss.2015.11.008
Echer, E., Bolzan, M. J. A., and Franco, A. M. S. (2020). Statistical analysis of solar wind parameter variation with heliospheric distance: Ulysses observations in the ecliptic plane. Adv. Space Res., 65(12), 2846–2856. https://doi.org/10.1016/j.asr.2020.03.036
Espley, J. R., Cloutier, P. A., Brain, D. A., Crider, D. H., and Acuña, M. H. (2004). Observations of low-frequency magnetic oscillations in the Martian magnetosheath, magnetic pileup region, and tail. J. Geophys. Res., 109(A7), A07213. https://doi.org/10.1029/2003JA010193
Formisano, V. (1984). Solar wind interaction with planetary objects. In Società Astronomica Italiana, Annual Meeting, 27th, Brescia, Italy, Oct. 21-23, 1983. Società Astronomica Italiana, Memorie (ISSN 0037-8720), 55 (3), 511–514.
Fowler, C. M., Anderson, L., Ergun, R. E., Harada, Y., Hara, T., Collinson, G., Peterson, W. K., Espley, J., Halekas, J., … Jakosky, B. M. (2018). MAVEN observations of solar wind driven magnetosonic waves heating the Martian dayside ionosphere. J. Geophys. Res. :Space Phys., 123(5), 4129–4149. https://doi.org/10.1029/2018JA025208
Franco, A. M. S., Fränz, M., Echer, E., and Bolzan, M. J. A. (2020). Wavelet analysis of low frequency plasma oscillations in the magnetosheath of Mars. Adv. Space Res., 65(9), 2090–2098. https://doi.org/10.1016/j.asr.2019.09.009
Fränz, M., Dubinin, E., Roussos, E., Woch, J., Winningham, J. D., Frahm, R., Coates, A. J., Fedorov, A., Barabash, S., and Lundin, R. (2006). Plasma moments in the environment of mars. Space Sci. Rev., 126, 165–207. https://doi.org/10.1007/s11214-006-9115-9
Frisch, U. (1995). Turbulence: The Legacy of A. N. Kolmogorov. Cambridge: Cambridge University Press.
Habbal, S. R., Woo, R., Fineschi, S., O'Neal, R., Kohl, J., Noci, G., and Korendyke, C. (1997). Origins of the slow and the ubiquitous fast solar wind. Astrophys. J., 489, L103–L106. https://doi.org/10.1086/310970
Hadid, L. Z., Sahraoui, F., Galtier, S., and Huang, S. Y. (2018). Compressible magnetohydrodynamic turbulence in the Earth's magnetosheath: Estimation of the energy cascade rate using in situ spacecraft data. Phys. Rev. Lett., 120, 055102. https://doi.org/10.1103/PhysRevLett.120.055102
Halekas, J. S., Ruhunusiri, S., Harada, Y., Collinson, G., Mitchell, D. L., Mazelle, C., Mcfadden, J. P., Connerney, J. E. P., Espley, J. R., … Jakosky, B. M. (2017). Structure, dynamics, and seasonal variability of the Mars-solar wind interaction: MAVEN Solar Wind Ion Analyzer in-flight performance and science results. J. Geophys. Res. :Space Phys., 122, 547–578. https://doi.org/10.1002/2016JA023167
Hall, B. E. S., Lester, M., Sánchez-Cano, B., Nichols, J. D., Andrews, D. J., Edberg, N. J. T., Opgenoorth, H. J., Fränz, M., Holmström, M., … Orosei, R. (2016). Annual variations in the Martian bow shock location as observed by the Mars Express mission. J. Geophys. Res. :Space Phys., 121(11), 11474–11494. https://doi.org/10.1002/2016JA023316
Hall, B. E. S., Sánchez-Cano, B., Wild, J. A., Lester, M., and Holmström, M. (2019). The Martian bow shock over solar cycle 23-24 as observed by the Mars Express mission. J. Geophys. Res. :Space Phys., 124(6), 4761–4772. https://doi.org/10.1029/2018JA026404
Han, X., Fraenz, M., Dubinin, E., Wei, Y., Andrews, D. J., Wan, W., He, M., Rong, Z. J., Chai, L., . . Barabash, S. (2014). Discrepancy between ionopause and photoelectron boundary determined from Mars express measurements. Geophys. Res. Lett., 41(23), 8221–8227. https://doi.org/10.1002/2014GL062287
Hundhausen, A. J. (1972). Coronal expansion and solar wind. Physics and Chemistry in Space, 5, 10–13. Berlin, Heidelberg: Springer.
Kiyani, K., Chapman, S. C., Hnat, B., and Nicol, R. M. (2007). Self-similar signature of the active solar corona within the inertial range of solar-wind turbulence. Phys. Rev. Lett., 98(21), 211101. https://doi.org/10.1103/PhysRevLett.98.211101
Kolmogorov, A. N. (1962). A refinement of previous hypotheses concerning the local structure of turbulence in a viscous incompressible fluid at high Reynolds number. J. Fluid Mech., 13(1), 82–85. https://doi.org/10.1017/S0022112062000518
Kozak, L. V., Pilipenko, V. A., Chugunova, O. M., and Kozak, P. N. (2011). Statistical analysis of turbulence in the foreshock region and in the Earth’s magnetosheath. Cosmic Res., 49(3), 194–204. https://doi.org/10.1134/S0010952511030063
Krieger, A. S., Timothy, A. F., and Roelof, E. C. (1973). A coronal hole and its identification as the source of a high velocity solar wind stream. Sol. Phys., 29(2), 505–525. https://doi.org/10.1007/BF00150828
Lacombe, C., and Belmont, G. (1995). Waves in the Earth's magnetosheath: Observations and interpretations. Adv. Space Res., 15(8-9), 329–340. https://doi.org/10.1016/0273-1177(94)00113-F
Leckband, J. A., Burgess, D., Pantellini, F. G. E., and Schwartz, S. J. (1995). Ion distributions associated with mirror waves in the Earth's magnetosheath. Adv. Space Res., 15(8-9), 345–348. https://doi.org/10.1016/S0273-1177(99)80106-9
Luhmann, J. G., Russell, C. T., and Elphic, R. C. (1986). Spatial distributions of magnetic field fluctuations in the dayside magnetosheath. J. Geophys. Res., 91(A2), 1711–1715. https://doi.org/10.1029/JA091IA02P01711
Luhmann, J. G., Russell, C. T., Scarf, F. L., Brace, L. H., and Knudsen, W. C. (1987). Characteristics of the Marslike limit of the Venus-solar wind interaction. J. Geophys. Res. :Space Phys., 92(A8), 8545–8557. https://doi.org/10.1029/JA092iA08p08545
Luhmann, J. G. , Russell, C. T. , Brace, L. H. , and Vaisberg, O. L. (1992). The intrinsic magnetic field and solar wind interaction of Mars. In H. Kieffer, et al. (Eds. ), Mars, 1090–1134. Tucson, Arizona: University of Arizona Press.
Macek, W. M., Wawrzaszek, A., and Kucharuk, B. (2018). Intermittent turbulence in the heliosheath and the magnetosheath plasmas based on Voyager and THEMIS data. Nonlin. Processes Geophys. Discuss., 25, 39–54. https://doi.org/10.5194/npg-25-39-2018
Marsch, E. and Liu, S. (1993). Structure functions and intermittency of velocity fluctuations in the inner solar wind. Ann. Geophys., 11, 227–238.
Matthaeus, W. H., Wan, M. P., Servidio, S., Greco, A., Osman, K. T., Oughton, S., and Dmitruk, P. (2015). Intermittency, nonlinear dynamics and dissipation in the solar wind and astrophysical plasmas. Phil. Trans. R. Soc. A, 373(2041), 20140154. https://doi.org/10.1098/rsta.2014.0154
Nagy, A. F., Winterhalter, D., Sauer, K., Cravens, T. E., Brecht, S., Mazelle, C., Crider, D., Kallio, E., Zakharov, E., … Trotignon, J. G. (2004). The plasma environment of Mars. Space Sci. Rev., 111, 33–114. https://doi.org/10.1023/B:SPAC.0000032718.47512.92
Opgenoorth, H. J., Andrews, D. J., Fränz, M., Lester, M., Edberg, N. J. T., Morgan, D., Duru, F., Witasse, O., and Williams, A. O. (2013). Mars ionospheric response to solar wind variability. J. Geophys. Res. :Space Phys., 118(10), 6558–6587. https://doi.org/10.1002/jgra.50537
Osmane, A., Dimmock, A. P., and Pulkkinen, T. I. (2015). Universal properties of mirror mode turbulence in the Earth’s magnetosheath. Geophys. Res. Lett., 42(9), 3085–3092. https://doi.org/10.1002/2015GL063771
Ramstad, R., Barabash, S., Futaana, Y., and Holmström, M. (2017). Solar wind and EUV-dependent models for the shapes of the Martian plasma boundaries based on Mars Express measurements. J. Geophys. Res. :Space Phys., 122(7), 7279–7290. https://doi.org/10.1002/2017JA024098
Ruhunusiri, S., Halekas, J. S., Espley, J. R., Mazelle, C., Brain, D., Harada, Y., Dibraccio, G. A., Livi, R., Larson, D. E., … Howes, G. G. (2017). Characterization of turbulence in the Mars plasma environment with MAVEN observations. J. Geophys. Res. :Space Phys., 122(1), 656–674. https://doi.org/10.1002/2016JA023456
Russell, C., Chou, E., Luhmann, J., Gazis, P.,Brace, L., Hoegy, Walter. (1988). Solar and interplanetary control of the location of the Venus bow shock. J. Geophys. Res., 93. https://doi.org/10.1029/JA093iA06p05461
Russell, C. T., Luhmann, J. G., Schwingenschuh, K., Riedler, W., and Yeroshenko, Y. (1990). Upstream waves at Mars: Phobos observations. Geophys. Res. Lett., 17(6), 897–900. https://doi.org/10.1029/GL017i006p00897
Schwartz, S. J., Burgess, D., and Moses, J. J. (1996). Low-frequency waves in the Earth’s magnetosheath: Present status. Ann. Geophys., 14(11), 1134–1150. https://doi.org/10.1007/S00585-996-1134-Z
Sciffer, M. D., Waters, C. L., and Menk, F. W. (2004). Propagation of ULF waves through the ionosphere: inductive effect for oblique magnetic fields. Ann. Geophys., 22(4), 1155–1169. https://doi.org/10.5194/angeo-22-1155-2004
Shan, L. C., Ge, Y. S., and Du, A. M. (2020). A case study of large-amplitude ULF waves in the Martian foreshock. Earth Planet. Phys., 4(1), 45–50. https://doi.org/10.26464/epp2020004
Shan, L. C. , Lu, Q. M. , Mazelle, C. , Huang, C. , Zhang, T. L. , Wu, M. Y. , Gao, X. L. , and Wang, S. (2015). The shape of the Venusian bow shock at solar minimum and maximum: revisit based on VEX observations. Planet. Space Sci. , 109-110, 32–37.
Sheeley, N. R. Jr., Harvey, J. W., and Feldman, W. C. (1976). Coronal holes, solar wind streams, and recurrent geomagnetic disturbances: 1973-1976. Sol. Phys., 49(2), 271–278. https://doi.org/10.1007/BF00162451
Tsurutani, B. T., and Rodriguez, P. (1981). Upstream waves and particles: An overview of ISEE results. J. Geophys. Res., 86(A6), 4317–4324. https://doi.org/10.1029/JA086iA06p04317
Withers, P., Matta, M., Lester, M., Andrews, D., Edberg, N. J. T., Nilsson, H., Opgenoorth, H., Curry, S., Lillis, R., … Witasse, O. (2016). The morphology of the topside ionosphere of Mars under different solar wind conditions: Results of a multi-instrument observing campaign by Mars Express in 2010. Planet. Space Sci., 120, 24–34. https://doi.org/10.1016/j.pss.2015.10.013
Table
1.
Solar longitude LS dates. Perihelion range (210≤LS<300), Aphelion range (30≤LS<120), Northern Hemisphere Autumn Equinox (120≤LS<210), and Northern Hemisphere Spring Equinox (300≤LS<30).


 DownLoad: